
Here are all 181 Hydrology, Water Resources and Engineering questions asked in UPSC Civil Engineering Optional Paper II from 2004 to 2026, arranged under the 13 topics of the official syllabus. Within each topic the latest questions come first.
Each question ends with a code such as [2024/15m/3b] – the year, the marks, the word limit (where UPSC set one) and the question number in the paper.
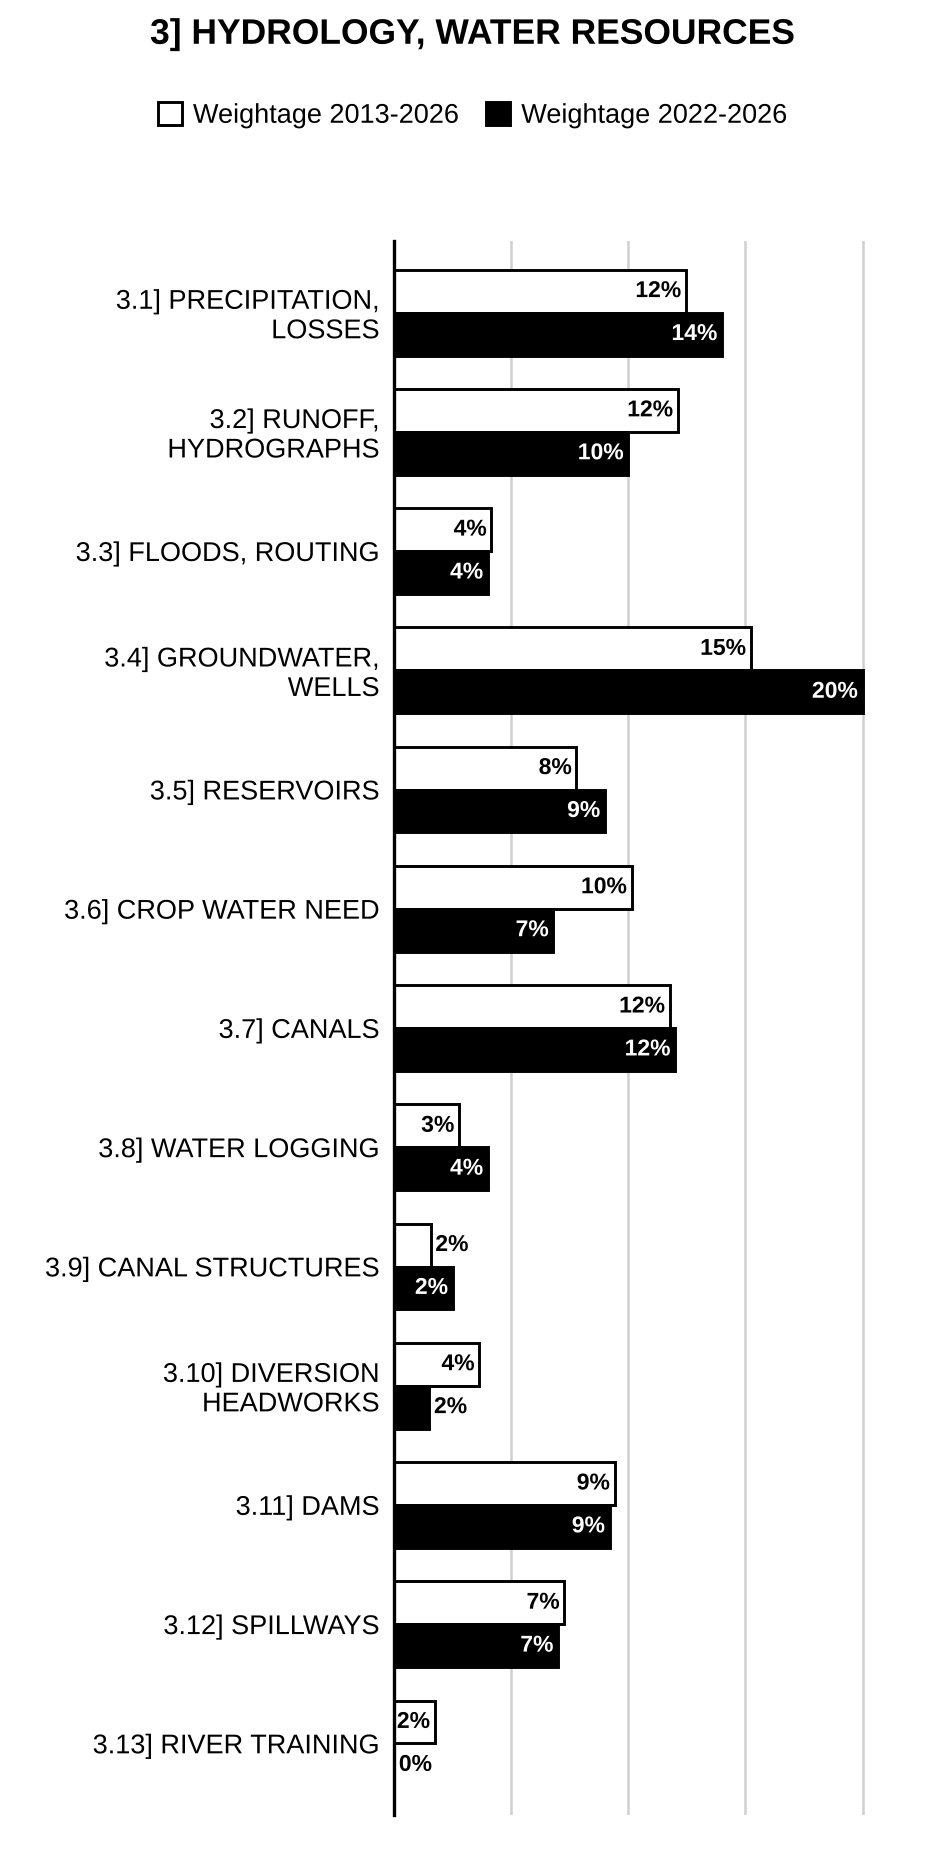
3.1] Hydrological cycle and precipitation
16 questions
A catchment has six rain gauge stations. The annual rainfall recorded by the gauges in a year is as follows:
| Station | A | B | C | D | E | F |
| Rainfall (cm) | 82.7 | 102.9 | 180.3 | 110.3 | 95.8 | 136.70 |
(i) Determine the standard error in the estimation of mean rainfall in the existing set of rain gauges. (ii) For a 10% error in the estimation of mean rainfall, calculate the optimum number of rain gauge stations in the catchment. [2026/10m/5b]
A storm over a catchment of area had a duration of 14 hours. The mass curve of rainfall of the storm is as follows:
| Time from Start of Storm, (h) (1) | Accumulated Rainfall (cm) (2) |
| 0 | 0 |
| 2 | 0.6 |
| 4 | 2.8 |
| 6 | 5.2 |
| 8 | 6.7 |
| 10 | 7.5 |
| 12 | 9.2 |
| 14 | 9.6 |
If the index for the catchment is 0.4 cm/h, determine (i) the effective rainfall (ER) hyetograph and (ii) the volume of direct runoff from the catchment due to the storm. Show clearly one set of calculations and summarize your results in a tabular form. (iii) Also, plot the effective rainfall hyetograph. [2025/20m/6a]
Explain the following terms: (i) Evaporation (ii) Transpiration (iii) Evapotranspiration (iv) Infiltration. [2024/10m/5b]
A catchment has five raingauge stations. In a year, the annual rainfall recorded by the raingauges are 72.3 cm, 86.4 cm, 94.2 cm, 103.8 cm and 71.4 cm respectively. For a 5% error in the estimation of mean rainfall, find the additional number of raingauges needed. [2024/10m/5c]
The annual precipitation and evaporation from each of the sub-areas P, Q, R and S are given below for a catchment.
| Sub-area | Area (km²) | Annual Precipitation (mm) | Annual Evaporation (mm) |
| P | 15 | 1000 | 500 |
| Q | 5 | 800 | 400 |
| R | 10 | 900 | 440 |
| S | 18 | 1200 | 650 |
Calculate the following for catchment: (i) Annual average precipitation (ii) Annual average evaporation (iii) Annual runoff coefficients for the sub-areas and for the total catchment taken as a whole assuming no change in the ground water storage on an annual basis. [2023/10m/5b]
A catchment has six rain gauge stations. In a year, the annual rainfall recorded by the rain gauges are as follows:
| Station | A | B | C | D | E | F |
| Rainfall (cm) | 90 | 100 | 200 | 130 | 120 | 150 |
Determine: (i) The standard error in the estimation of mean rainfall in the existing set of rain gauges. (ii) Optimum number of rain gauges in the catchment for 22% error and 5% error. [2022/10m/5a]
Give five main human actions that affect the hydrological cycle and identify the components affected by each of these. [2020/10m/5a]
The rainfall of magnitude 40 mm and 30 mm occurring on two consecutive 4-hour durations on a catchment area of produced the following hydrograph of the flow at the outlet of the catchment:
| Time from start of rainfall (hr) | −12 | 0 | 12 | 24 | 36 | 48 | 60 | 72 | 90 | 108 |
| Observed flow () | 7 | 5 | 15 | 27 | 22 | 17 | 13 | 9 | 5 | 5 |
Assuming a constant base flow , determine the rainfall excess and -index. [2020/20m/7b]
The normal annual rainfalls at stations A, B, C and D in a basin are 80.97 cm, 67.59 cm, 76.28 cm and 92.01 cm respectively. In the year 1985, station D was inoperative and stations A, B and C recorded annual precipitation of 91.11 cm, 72.23 cm and 79.89 cm respectively. Estimate the rainfall at station D in that year. [2019/10m/5a]
A catchment has six rain gauge stations. In a year, the annual rainfalls recorded by the gauges are as follows:
| Station | A | B | C | D | E | F |
| Rainfall (in cm) | 82.6 | 102.9 | 180.3 | 110.3 | 98.8 | 136.7 |
(i) Determine the standard error in the estimation of mean rainfall in the existing set of rain gauges. (ii) For a 10% error in the estimation of the mean rainfall, calculate the optimum number of rain gauge stations in the catchment. [2019/15m/7b]
The normal annual precipitations of 5 rain gauges , , , and are 1250 mm, 1020 mm, 760 mm, 1130 mm and 1370 mm respectively. During a particular storm, the precipitations recorded by the stations , , and are 132 mm, 92 mm, 68 mm and 102 mm respectively. The instrument at station was inoperative during the storm. Estimate the rainfall at station during that storm. [2018/10m/5a]
The initial rainfall intensities of a storm during dry weather flow are 12, 16, 22, 45, 42, 38, 29, 15, 18, 25, 42, 38, 24, 12 and 3 mm/hr at 20 minutes interval. The area of basin is 750 and index is 18 mm/hr. What will be the runoff volume of the basin, if the initial abstraction is 10 mm? [2016/10m/5e]
Describe the methods used for determining mean depth of precipitation in catchments when point rainfall data are available. [2015/15m/6b]
Explain the following: (i) Meteorologically homogeneous areas (ii) Recurrence interval of rain-storm The accumulated rainfalls at a raingauge station for various durations are listed below. Construct maximum intensity – duration curve. Comment on the nature of curve.
| Time in minutes | Accumulated Rainfall in cm | Time in minutes | Accumulated Rainfall in cm |
| 0 | 0 | 40 | 5.23 |
| 5 | 0.15 | 45 | 5.64 |
| 10 | 0.38 | 50 | 6.05 |
| 15 | 1.78 | 60 | 6.86 |
| 20 | 3.05 | 80 | 8.71 |
| 25 | 3.86 | 100 | 10.54 |
| 30 | 4.32 | 120 | 11.05 |
| 35 | 4.83 |
[2013/20m/6a]
Explain with the help of a neat sketch the hydrological cycle indicating its various phases. [2011/10m/6c(i)]
Discuss different forms of precipitation. How measurement of precipitation is done? [2011/10m/6c(ii)]
3.2] Runoff and hydrographs
18 questions
What is the difference between a flood hydrograph and a mass curve? Using the following data of a river at a dam site, construct and plot a flood hydrograph and find the values of minimum and maximum discharge in the river.
| Month | Flow () |
| January | 110 |
| February | 120 |
| March | 130 |
| April | 140 |
| May | 150 |
| June | 160 |
| July | 180 |
| August | 210 |
| September | 170 |
| October | 140 |
| November | 110 |
| December | 100 |
[2026/10m/5a]
What is a flood hydrograph? The monthly discharge (Q) data of a river at a gauging station are given below:
| Month | Q (m³/s) |
| January | 30 |
| February | 40 |
| March | 50 |
| April | 60 |
| May | 80 |
| June | 90 |
| July | 100 |
| August | 120 |
| September | 110 |
| October | 90 |
| November | 80 |
| December | 70 |
Draw the hydrograph and using the graph find peak flow and minimum flow in the river. [2024/10m/5a]
A 6-hour unit hydrograph has the following ordinates:
| Time (hr) | 0 | 6 | 12 | 18 | 24 | 30 | 36 | 42 | 48 | 54 | 60 |
| 6-hr UH ordinate (m³/s) | 0 | 200 | 550 | 750 | 650 | 550 | 400 | 270 | 150 | 50 | 0 |
If index is 0.3 cm/hr and base flow is 25 m³/s, determine the ordinates of resulting hydrograph of flow in the catchment due to the storm given below:
| Time from start of storm (hr) | 0 | 6 | 12 | 18 |
| Accumulated rainfall (cm) | 0 | 3 | 8 | 12 |
[2023/10m/5a]
Define unit hydrograph. Explain two basic assumptions made in the derivation of a unit hydrograph. What are the applications and limitations of unit hydrograph? [2022/10m/6a(i)]
Given the ordinates of a 4 hr unit hydrograph as below, derive the ordinates of a 12 hr unit hydrograph by using the method of superposition.
| Time (h) | Ordinate of 4 hr UH () |
| 0 | 0 |
| 4 | 30 |
| 8 | 120 |
| 12 | 200 |
| 16 | 250 |
| 20 | 210 |
| 24 | 130 |
| 28 | 75 |
| 32 | 50 |
| 36 | 20 |
| 40 | 10 |
| 44 | 0 |
(Only derive the ordinates. Do not plot the graph.) [2022/10m/6a(ii)]
A one-hour unit hydrograph of a catchment is shown in the figure. A storm of two hours duration with intensity of 70 mm/h in the first hour and 40 mm/h in the second hour occurs over the catchment. Calculate the peak direct surface runoff value in .
[Figure: Triangular one-hour unit hydrograph: Discharge () against Time (h). Ordinates: 0 at t = 0, rising linearly to a peak of 3 at t = 1 h, then falling linearly through 2 at 2 h and 1 at 3 h to 0 at t = 4 h.] [2021/10m/5a]
From the basin map of a given watershed with drainage area , the length of the mainstream (L) is measured as 125 km. The distance () from the outlet to a point on the stream nearest the centroid of the watershed area is measured as 90 km. The regional constant for the watershed is 0.75 and . From the unit hydrograph derived for the watershed, the following are determined: rainfall duration h, basin lag h and peak discharge . Determine the coefficients and for the synthetic unit hydrograph of the watershed. [2021/20m/8a]
To compute the discharge in a small stream by velocity-area method, the stream width was divided into seven segments of 1.5 m width each. The average depths and the velocities measured in the segments by current meter are given in the table below. Compute the discharge in the stream:
| Segment No. | Average depth, (m) | Velocity (m/s) at | Velocity (m/s) at | Velocity (m/s) at |
| 1 | 0.4 | 0.4 | ||
| 2 | 0.7 | 0.76 | 0.70 | |
| 3 | 1.2 | 1.13 | 1.19 | |
| 4 | 1.4 | 1.25 | 1.29 | |
| 5 | 1.1 | 1.09 | 1.13 | |
| 6 | 0.8 | 0.69 | 0.65 | |
| 7 | 0.45 | 0.42 |
[2020/20m/6a]
A catchment has a 4-hour concentration time with 1-hour intervals, resulting in the time-area histogram as shown below:
[Figure: Time-area histogram – Area () against Time (hr), axis marked 0 to 6: 10 for 0–1 hr, 30 for 1–2 hr, 20 for 2–3 hr, 40 for 3–4 hr.]
A 6-hour storm has the following effective rainfall hyetograph ordinates:
| Time (hr) | 0–1 | 1–2 | 2–3 | 3–4 | 4–5 | 5–6 |
| Effective rainfall (mm/hr) | 5 | 10 | 20 | 15 | 10 | 5 |
Use the time-area method to calculate the outflow hydrograph for this catchment. [2020/15m/6c]
A rural watershed consists of– of forest area with of agricultural area with of unpaved streets with of green cover with of residential area with where = coefficient of runoff. Estimate the peak runoff rate for rainfall with a return period () of 25 years, if the intensity-duration-frequency relationship for the watershed is where = rainfall intensity in mm/hr, = return period in year, = duration of rainfall in minutes. The watershed has a time of concentration of 50 minutes. [2018/15m/6b]
A catchment experiences a 2-hour duration isolated storm and the peak of the flood hydrograph due to this storm was found to be . The total depth of rainfall was 47 mm. Estimate the peak of the 2-hour unit hydrograph of this catchment, assuming a constant base flow of and an average infiltration rate of 2.5 mm/hr. If the area of the catchment is , determine the base width of the 2-hour unit hydrograph assuming that the unit hydrograph is triangular in shape. [2018/20m/6c]
Define hydrograph. With a neat sketch, explain any two methods of base-flow separation from a hydrograph. [2017/5m/6a(i)]
List the methods available for estimation of runoff in catchments. In detail, explain the rational method used for estimation of runoff in urban catchments. [2015/10m/5a]
Explain briefly the procedure to be followed in developing a unit hydrograph from the recorded flood hydrograph of a stream, stating the assumptions. [2013/10m/5d]
Explain and differentiate between unit hydrograph (UH) and Instantaneous unit hydrograph. Also explain the computational steps for deriving 2h UH from a 6h UH. [2012/10m/3b(ii)]
What is unit hydrograph? Explain various propositions of the unit hydrograph. [2011/10m/7c(i)]
Explain various steps adopted to derive a unit hydrograph from an observed flood hydrograph. [2011/10m/7c(ii)]
Ordinates of a 4-hr unit hydrograph (u.h.g.) on a catchment are tabulated. Derive the ordinates of a 2-hr u.h.g. for the same catchment.
| Time (hr) | 0 | 4 | 8 | 12 | 16 | 20 | 24 | 28 |
| Ordinate of 4-hr u.h.g. () | 0 | 23 | 54 | 60 | 25 | 14 | 6 | 0 |
[2004/20m/7a]
3.3] Floods and flood routing
12 questions
A box culvert has an expected life of 10 years. (i) If the acceptable risk of at least one event exceeding the culvert capacity during the design life is 5 percent, what design period should be used? (ii) What is the chance that the box culvert designed for an event of this return period will not have its capacity exceeded for 50 years? [2025/10m/5a]
Route the above flood hydrograph through a river reach: The value of and in the Muskingham equation have been identified as 0.25 and 8 hr. The initial outflow discharge from the reach is 10 m³/s.
| Time (hr) | 0 | 4 | 8 | 12 | 16 | 20 | 24 | 28 |
| Inflow (m³/s) | 10 | 20 | 30 | 30 | 25 | 20 | 35 | 12 |
[2023/10m/5c]
A temporary coffer dam is to be built to protect the 5 year construction activity for a major river valley project. If the coffer dam is designed to withstand the 25-year flood, what is the risk that the structure will be overtopped in the third year? [2021/10m/5b]
Define flood routing. Distinguish between hydraulic routing and hydrologic routing. [2017/5m/8a(i)]
Briefly explain the basic concepts used in storage outflow routing and Muskingum routing. [2017/5m/8a(ii)]
Write a brief note on kinematic flood routing. [2017/5m/8a(iii)]
A Small Reservoir has the following Storage-Elevation relationship:
| Elevation (m) | 55.00 | 58.00 | 60.00 | 61.00 | 62.00 | 63.00 |
| Storage () | 250 | 650 | 1000 | 1250 | 1500 | 1800 |
A spillway provided with its crest at elevation 60.00 m has the discharge relationship as , where ‘H’ is the head of water over the spillway crest. Develop an Elevation v/s Storage relationship to be used for Reservoir Routing. Take Hrs. [2014/15m/6a]
Explain the impact of flood wave on river water levels and flood travel time and explain the terms ‘prism storage’, ‘wedge storage’ and ‘Negative wedge storage’ with a suitable sketch. Also write an equation for flood routing where storage is expressed as a function of inflow and outflow in the river reach. [2012/12m/1e]
Annual flood data of a river for 30 years yielded mean annual discharge of and a standard deviation of . For a proposed bridge on this river, it is decided to have an acceptable risk of 10% and service life of 50 years. 1. Estimate the flood discharge for design of bridge. 2. If the actual flood value adopted in the design is , what is the safety margin for maximum flood discharge? (Given that Reduced mean and Standard deviation for Gumbel distribution for 30 years are 0.5380 and 1.119 respectively.) [2012/20m/2c]
Explain if, and, if so, how, the Muskingham method can be realigned into the concept of stage slope method of flow computation in a river reach? If not, explain why not? [2010/12m/5a]
The flood record for a period of 25 years of a small tributary of a main river has been analysed based on the assumption that the distribution is log-Normal. The mean ‘’ and standard deviation of the distribution have been found to be and . Find the magnitude of 100 and 1000 yr return period flood. [2009/20m/7a]
For a station , the recorded annual 24-hr maximum rainfall are given below. Compute the necessary data to estimate: (a) 24-hr maximum rainfall with a specified return period; and (b) probability of a rainfall of not less than a specified depth occurring in 24 hours at station . Indicate the above features on a sketch (not necessarily plotted to exact data) prescribing the coordinate parameters.
| 1. Year | 1960 | 61 | 62 | 63 | 64 | 65 | 66 | 67 | 68 | 69 | |
| 2. Rainfall, cm | 14.2 | 13.1 | 7.5 | 14.9 | 12.4 | 14.2 | 7.0 | 16.1 | 8.3 | 9.2 | |
| 1. Year | 70 | 71 | 72 | 73 | 74 | 75 | 76 | 77 | 78 | 79 | 80 |
| 2. Rainfall, cm | 7.0 | 13.4 | 7.5 | 14.0 | 15.2 | 6.5 | 9.7 | 13.1 | 8.8 | 14.7 | 11.2 |
[2004/20m/6a]
3.4] Groundwater flow and wells
22 questions
A 30 cm diameter well penetrates 25 m below the static water table. After 24 hrs of pumping @ 5400 /min, the water table in a test well 90 m away is lowered by 0.53 m and in another well 30 m away, the drawdown is 1.11 m. What is the transmissivity of the aquifer? [2026/10m/5c]
A well fully penetrates a 50 m thick confined aquifer. After a long period of pumping at a constant rate of , the drawdowns at distances of 50 m and 150 m from the well are observed to be 3 m and 1.2 m respectively. With the help of a sketch, determine the hydraulic conductivity and the transmissivity. [2025/10m/5b]
Explain an aquifer. Deduce the expression for discharge (Q) through a well in an unconfined aquifer taking usual symbols. If the permeability of the aquifer, m/s, radius of drawdown curve, R = 500 m, radius of well, r = 5.0 m, total aquifer thickness, H = 30 m and depth of water in well, h = 10 m, find the steady discharge. [2024/20m/6a]
Explain the following: (i) Aquitard (ii) Specific retention (iii) Storage coefficient (iv) Coefficient of permeability (v) Darcy’s Law. [2024/15m/7b]
(i) A 50 cm well in an unconfined aquifer of saturated thickness 45 m yields 600 lpm under a drawdown of 3 m at the pumping well. What will be the discharge under a drawdown of 6 m? Consider the radius of influence as 500 m. (ii) What will be the discharge in a 30 cm well under a drawdown of 3 m for the unconfined aquifer as mentioned in part (i). [2023/20m/6a]
Explain the following: (i) Specific capacity of a well (ii) Specific yield of an aquifer (iii) Perched water table (iv) Intrinsic permeability (v) Bulk pore velocity. [2023/15m/7b]
In a confined aquifer whose thickness is 40 m, a well is fully penetrated. Under steady state condition, it is pumped with a constant discharge of . The drawdowns observed at two wells located at 20 m and 200 m from the well are 3.5 m and 0.5 m respectively. Determine the transmissibility and permeability of the aquifer. [2022/10m/5b]
A 0.5 m diameter well fully penetrates an unconfined aquifer whose bottom is 150 m below the undisturbed ground water table. When pumped at a steady rate of , the drawdowns observed in two observation wells at radial distances of 10 m and 50 m are respectively 10 m and 5 m. Determine the drawdown in the well. [2021/15m/7b]
Determine the yield from a tube well of 200 mm radius penetrating in an unconfined aquifer of depth 18 m. The depth of water in the well, after drawdown, is 12 m. The permeability of soil is 25 m/day and the radius of the circle of influence is 250 m. [2020/10m/5b]
An artesian tube well has a diameter of 20 cm. The thickness of aquifer is 30 cm and its permeability is 38 m/day. Find its yield under a drawdown of 4 m at the well face. Use radius of influence as recommended by Sichardt. [2019/10m/5b]
Distinguish between: (i) Aquifer and Aquitard (ii) Influent and Effluent streams (iii) Unconfined aquifer and Leaky aquifer (iv) Specific yield and Specific retention of aquifer (v) Water table and Piezometric surface. [2018/15m/6a]
Explain the mechanism of release of water into unconfined and confined aquifers. List the assumptions made in the derivation of flow equation in an aquifer. [2017/5m/5a(i)]
A well with radius of 0.3 m is drilled in an unconfined aquifer. Initial water table is 30 m above the bed. Estimate the amount of water that can be pumped if the maximum drawdown is restricted to 8 m. Assume: Hydraulic conductivity = 25 m/day Radius of influence = 300 m. [2017/5m/5a(ii)]
Explain well loss and aquifer loss along with figures and equations. [2016/10m/6a(i)]
Explain well development and list the well development methods. [2016/5m/6a(ii)]
A 20 cm well penetrates 30 m below the static water level. Water is pumped at the rate of 1800 lpm, and the drawdown in the wells is observed as 1.2 m and 0.6 m. The observation wells are 12 m and 36 m from the well. Determine— (i) the transmissibility of the aquifer; (ii) the drawdown in the pumped well taking R as 300 m; (iii) the specific capacity of the well. [2015/15m/6a]
A field test for permeability consists in observing the time required for a tracer to travel between two observation wells. The tracer was found to take 10 hrs. to travel between two wells 50 m. apart when the difference in water surface elevation in them was 0.5 m. The mean particle size of the Aquifer was 2 mm and the porosity of the medium is 0.3. If the kinematic viscosity ‘’ = , estimate: (i) The Coefficient of Permeability and Intrinsic Permeability of Aquifer. (ii) The Reynolds Number of the flow. [2014/10m/5e]
A well is drilled to an impermeable base in the centre of a circular island 1760 m diameter located in a large lake. The well completely penetrates a sandstone aquifer 16 m thick overlaid by an impermeable clay. The sandstone has permeability of 16 m per day. What will be the steady discharge if the drawdown of the piezometric surface is not to exceed 3 m at the well? The diameter of the well is 0.3 m. Draw a sketch showing the well and the aquifer system. [2013/20m/8a]
What is an aquifer? How are they classified? Describe salient features of aquifers. [2011/10m/5c]
What is Darcy’s coefficient of permeability? How is it determined? Draw the necessary sketches. [2010/10m/6c(i)]
How would the radial flow in an open well be determined under steady state flow conditions when the aquifer is (a) unconfined, and (b) confined? [2010/10m/8c(i)]
Outline briefly the concept of ‘Groundwater Budgeting’ and its importance in the determination of the safe yield from the basin. [2009/12m/5a]
3.5] Water resources and reservoirs
16 questions
The following information is available regarding the relationship between trap efficiency and capacity-inflow ratio for a reservoir:
| Capacity-Inflow Ratio | Trap Efficiency |
| 0.1 | 87 |
| 0.2 | 93 |
| 0.3 | 95 |
| 0.4 | 95.5 |
| 0.5 | 96 |
| 0.6 | 96.5 |
| 0.7 | 97 |
| 0.8 | 97.2 |
| 0.9 | 97.3 |
| 1.0 | 97.5 |
Find the probable life of the reservoir with an initial reservoir capacity of 30 million cubic metres, if the annual flood flow is 60 million cubic metres and average annual sediment inflow is 360000 tonnes. Assume a specific weight of sediment equal to . The useful life of the reservoir will terminate when 80% of initial capacity is filled with sediment. [2026/20m/6a]
Enumerate any five adverse effects of reservoir sedimentation. How can it be reduced? [2025/10m/5c]
Draw a Flow Mass Curve and explain how this will be useful in the estimation of the storage capacity of the reservoir for a constant demand. [2022/15m/7b]
Determine the storage capacity of a reservoir for the given cropping pattern, canal losses are 15% and reservoir losses are 10%.
| Sl. No. | Crop | Base period (days) | Duty at field (hect./cumec) | Area under crop (hect.) |
| 1. | Sugarcane | 360 | 800 | 6500 |
| 2. | Cotton | 200 | 1400 | 4200 |
| 3. | Wheat | 120 | 1800 | 3100 |
| 4. | Rice | 120 | 900 | 3200 |
| 5. | Vegetables | 120 | 700 | 1100 |
[2021/15m/6c]
With the aid of neat sketches, describe how a flow-mass curve could be used for the determination of the following: (i) Minimum storage needed to meet a constant demand (ii) Maximum constant maintainable demand from a given storage. [2020/15m/8b]
What are the requirements for the success of an irrigation project? [2018/10m/5c]
Explain step by step how reservoir capacity is decided using a mass inflow curve. [2017/5m/6a(ii)]
Distinguish between single-purpose reservoir and multi-purpose reservoir. Explain two important methods of allocation of water in a multi-purpose reservoir. [2017/5m/6a(iii)]
Write a note on reservoir sedimentation. [2017/5m/6b(iii)]
What do you understand by Capacity-Inflow Ratio in regard to Reservoir Sedimentation? How life of a Reservoir is determined from C/I Ratio and Trap Efficiency? [2014/10m/5d]
What are the different approaches for estimating sedimentation in Reservoirs? Draw a typical sketch to show the profile of silt deposition in Reservoir. [2013/10m/5a]
State and explain factors which influence the silting of reservoirs. How this affects the useful life of reservoir? Also explain the terms ‘live storage’, ‘dead storage’ and ‘effective storage’ in this context. [2012/10m/2b(ii)]
What do you understand by multipurpose reservoir? Describe in brief various investigations required for reservoir planning. [2011/10m/6b(i)]
What is reservoir sedimentation? Discuss various methods used for control of silting of reservoir. [2011/10m/6b(ii)]
Table below furnishes the kind of crop irrigated from the water of a reservoir by means of the canal system. The data about these crops are also furnished in the table.
| Kind of crop | Crop period in days | Area under crops in ha | Duty of water in the field in ha/cumec |
| Cotton | 240 | 3000 | 1430 |
| Sugarcane | 365 | 2000 | 860 |
| Wheat | 120 | 4000 | 2150 |
| Rice | 120 | 2000 | 860 |
Assume 30% losses of water in the entire canal system and 15% losses in the reservoir. Find the live storage of the reservoir in ha/m. [2009/20m/8b]
In single, as well as multiple, purpose water resources projects, how are benefits classified? Give brief explanation for each; also indicate the distinction between “with/without” and “before/after” considerations. [2004/10m/8b(i)]
3.6] Water requirements of crops
20 questions
Explain duty and delta. What is the discharge capacity required of the outlet to irrigate 2200 ha of sugarcane having a Kor depth of 17 cm and a Kor period of 30 days? [2024/7m/7c(ii)]
Define Delta, Duty and Base Period, and derive the relationship among them. [2023/7m/7c(i)]
With the help of a neat sketch, explain the effect of frequency of irrigation on average moisture content, field capacity and permanent wilting point. During a particular stage of crop growth, consumptive use of water is 3 mm/day. Determine frequency of irrigation and depth of water to be applied if the amount of water available in the soil is 50% and root zone depth is 100 mm. Assume irrigation efficiency to be 80%. [2022/10m/5c]
The Gross Command Area for a distributary is 15000 hectares, 80% of which can be irrigated. The intensity of irrigation for Rabi season is 60% and that for Kharif season is 30%. If the average duty at the head of the distributary is 2500 ha/cumec for Rabi season and 1500 ha/cumec for Kharif season, determine the discharge required at the head of the distributary. [2022/10m/8a(i)]
Determine the storage capacity of a reservoir for the given cropping pattern, canal losses are 15% and reservoir losses are 10%.
| Sl. No. | Crop | Base period (days) | Duty at field (hect./cumec) | Area under crop (hect.) |
| 1. | Sugarcane | 360 | 800 | 6500 |
| 2. | Cotton | 200 | 1400 | 4200 |
| 3. | Wheat | 120 | 1800 | 3100 |
| 4. | Rice | 120 | 900 | 3200 |
| 5. | Vegetables | 120 | 700 | 1100 |
[2021/15m/6c]
A watercourse has culturable commanded area of 2600 hectares, out of which the intensities of irrigation for perennial sugarcane and rice crops are 20% and 40%, respectively. The duties for these crops at the head of watercourse are 750 hectares/cumec and 1800 hectares/cumec, respectively. Find the discharge required at the head of watercourse if the peak demand is 120% of the average requirement. [2020/10m/5c]
A watercourse has a culturable commanded area of 1200 hectares. The intensity of irrigation for crop A is 40% and for crop B is 35%, both the crops being Rabi crops. Crop A has kor period of 20 days and crop B has kor period of 15 days. Calculate the discharge of the watercourse if the kor depth for crop A is 10 cm and for crop B, it is 16 cm. [2019/10m/5c]
Define permanent wilting point and field capacity. How is it useful in deciding the frequency of irrigation? [2017/5m/5b(i)]
Determine the frequency of irrigation using the following data: Consumptive use = 2.8 mm/day Root zone depth = 80 mm Irrigation efficiency = 65% Available soil moisture = 50% Also find the depth of water to be applied. [2017/5m/5b(ii)]
Determine the design discharge of a canal with the following data:
| Crop | Base period (Days) | Area (hectares) | Duty (hectares/cumec) |
| Sugarcane | 320 | 850 | 580 |
| Overlap sugarcane in hot weather | 90 | 120 | 580 |
| Wheat (Rabi) | 120 | 600 | 1600 |
| Bajri (Monsoon) | 120 | 500 | 2000 |
| Vegetables (Hot weather) | 120 | 360 | 600 |
Time factor of the canal = 15/20 Capacity factor = 0.75 [2017/5m/6b(i)]
The discharge of a tube well is 0.035 cumec and the infiltration capacity of soil is 6 cm/hr. The average depth of flow in the field is 15 cm. Calculate the time required to irrigate the strip of land of 0.06 hectare. [2016/10m/5d]
Define duty and delta. Derive a relationship between duty and delta. Using this relation, find delta for a crop with base period of 100 days. The duty of the crop is 432 ha/cumec. [2015/10m/5b]
The following data are collected to determine irrigation requirement. The water application efficiency is 65% and consumptive use coefficient in the growing season is 0.8. Find evapotranspiration and irrigation requirement:
| Month | Mean monthly temp. (in °C) | Monthly % sunshine (in hr) | Effective rainfall (in cm) |
| November | 18 | 7.20 | 2.6 |
| December | 15 | 7.15 | 2.8 |
| January | 13.5 | 7.30 | 3.5 |
| February | 14.5 | 7.10 | 2.0 |
[2015/20m/6c]
The following data pertains to the healthy growth of a Crop: (i) Field capacity of soil : 30% (ii) Permanent wilting percentage : 11% (iii) Density of soil : (iv) Effective Depth of Root Zone : 700 mm (v) Daily consumptive use of water for the given crop : 12 mm For healthy growth, moisture content must not fall below 25% of Water holding Capacity between the Field Capacity and the Permanent Wilting Point. Determine the Watering Interval in days. [2014/15m/8a]
Compare the following in irrigation system: (i) Water application efficiency vs. Water distribution efficiency (ii) Water storage efficiency vs. Consumption use efficiency The available moisture holding capacity of the soil of a field is 16 cm/m and the root zone depth is 1 m. A 12 hectare area is to be irrigated when 50% of the available moisture is depleted. The rate of peak consumption use is 4 mm/day and there is no effective rainfall. If the field application efficiency is 50%, determine the capacity of the irrigation stream. [2013/15m/6b]
During a particular stage of growth of a crop, consumptive use of water is 3.2 mm/day. Determine the interval between irrigations and depth of water to be applied when the amount of water available in the soil is (i) 35% (ii) 75% and (iii) 0% of the maximum depth of available water in the root zone which is 100 mm. Assume irrigation efficiency to be 60%. [2012/12m/1d]
Explain the terms duty and delta. Derive a relationship between the two. [2011/10m/7b(i)]
A soil has field capacity of 23% and wilting coefficient of 10%. If the root zone depth is 65 cm, determine the storage capacity of soil. Irrigation water is applied when moisture content falls to 10%. If water application efficiency is 70%, determine the water depth required to be applied in the field. The dry unit weight of soil is . [2011/10m/7b(ii)]
Table below furnishes the kind of crop irrigated from the water of a reservoir by means of the canal system. The data about these crops are also furnished in the table.
| Kind of crop | Crop period in days | Area under crops in ha | Duty of water in the field in ha/cumec |
| Cotton | 240 | 3000 | 1430 |
| Sugarcane | 365 | 2000 | 860 |
| Wheat | 120 | 4000 | 2150 |
| Rice | 120 | 2000 | 860 |
Assume 30% losses of water in the entire canal system and 15% losses in the reservoir. Find the live storage of the reservoir in ha/m. [2009/20m/8b]
Estimate the depth and frequency of irrigation required for a certain crop, given:
| Root zone depth | 90 cm |
| Field capacity | 22% |
| Wilting point | 12% |
| Apparent sp. gr. of soil | 1.5 |
| Consumptive use | 22 mm/day |
| Efficiency of irrigation | 60% |
Assume 50% depletion of available moisture as the indicator to begin application of irrigation water. [2004/12m/5c]

Preparing for Prelims too?
Our UPSC Prelims Topic-wise PYQ eBook covers every Prelims question with detailed explanations, so you can see exactly where UPSC asks from.
View the BookDownload Free Sample3.7] Canals
22 questions
Explain Lacey’s silt factor. If the value of this factor is 1.0, what does it indicate? The longitudinal slope of a canal running in an alluvial soil is 1/5000. Design the canal section and also find discharge (Q). Take Lacey’s silt factor, and the canal side slope as H : 1 V. [2026/15m/8a(i)]
An unlined irrigation channel in an alluvium of median size 0.30 mm is of trapezoidal section with bed width = 3.0 m, side slope = 1.5 H : 1 V and longitudinal slope = 0.00035. If this channel carries a discharge of at a depth of 0.8 m, then determine– (i) the average bed shear stress due to flow; (ii) the shear stress due to grains; (iii) the shear stress due to bed forms. Take . [2025/15m/7b]
What is Lacey’s Silt Factor? What is its value for standard silt? Design an earthen canal using Lacey’s silt theory with the following data: Full supply discharge, Q = 15 m³/s; Lacey’s silt factor, f = 1.0; Canal side-slope = H : 1 V. [2024/10m/8a(i)]
Design a trapezoidal concrete lined channel to carry a discharge of 300 m³/s at a slope of 1 in 4000. The side slope of the channel may be taken as 1.5 : 1. The value of for the lining material may be taken as 0.0125. Assume the ratio as 5. [2023/10m/8a(i)]
Explain Lacey’s Regime Theory. Define Initial Regime and Final Regime. Compare the Lacey’s Regime Theory with Kennedy’s Theory with respect to the design of alluvial channels. [2022/10m/8a(ii)]
Design a trapezoidal alluvial channel using Kennedy’s theory. The channel carries a discharge of with critical velocity ratio 1.0 and Manning’s roughness coefficient equal to 0.0225. Assume that the bed slope is equal to 1 in 5000 and the trapezoidal channel has side slope of 1 H : 2 V. [2020/15m/7a]
A channel section has to be designed for the following data: Discharge, cumecs Silt factor, Side slope Find also the longitudinal slope. Use Lacey’s theory. [2019/15m/6c]
An earthen canal is to be designed to irrigate an area of 18000 ha of wheat during Rabi season. The duty at the head of the canal is determined to be . Design a trapezoidal canal with a side slope of 1.5 H : 1 V. Permissible velocity = 0.9 m/s; B/D ratio = 6; Manning’s . [2018/15m/7a]
Explain Lacey’s regime theory. Define regime channel, initial regime and final regime. [2017/5m/8b(i)]
Explain the steps involved to design a channel using Lacey’s theory. [2017/5m/8b(ii)]
Compare Lacey’s theory and Kennedy theory. [2017/5m/8b(iii)]
Explain the problems associated with expansive soils while laying the canal lining and remedial measures. [2016/6m/5c(i)]
Discuss the purpose of safety ladders in lined canals along with details. [2016/4m/5c(ii)]
Discuss various maintenance problems posed by irrigation canals during their use and write the remedial measures. [2016/15m/8a]
Design an Alluvial Channel based on Lacey’s theory from the following data: (i) Discharge : 25 cumecs (ii) Lacey’s silt factor : 1.1 (iii) Side slopes : 1/2 H to 1 V Derive the Lacey’s Waterway and Regime Scour Depth Formulae. [2014/15m/6c]
(i) Explain the difference between contour canal and side slope canal. (ii) What are the losses of water from canals? State the various factors affecting their magnitude. (iii) Propose with a sketch, a suitable cross drainage work at the location of a canal crossing a stream. Give reasons for the selection. The canal and stream data are as under: Canal data Full supply discharge = 0.45 cumec Full supply level = R.L. 300.600 Canal bed level = R.L. 300.000 Canal bed width = 2 m Stream data High flood discharge = 6 cumec High flood level = R.L. 300.500 Stream bed level = R.L. 299.400 Natural ground level = R.L. 299.500 State the characteristic features of the selected structure. [2013/20m/7a]
What are the various causes of seepage and percolation losses from a canal? [2012/5m/4c(i)]
Explain the term “Hydraulically Efficient Channel Section”. Prove that the most efficient trapezoidal section is one half of a regular Hexagon. [2012/15m/4c(ii)]
What is open channel? List the design characteristics of open channel. [2011/10m/5a]
Consider a trapezoidal rigid boundary channel of 3 m base width with side slopes to , with depth of flow being 1.2 m, and , with adequate free board. Sketch the shear stress distribution on the wetted perimeter. Explain the facts of zero and maximum, if both are so possible, shear stresses on each of the side slopes and on the bed – with reasons therefor. [2010/20m/8a]
Show with the help of a suitable diagram the component parts of an irrigation canal system and briefly mention their respective functions. [2009/12m/5c]
A trapezoidal irrigation canal with side slope of 1.5 H to 1 V is proposed to be lined with bricks to reduce seepage losses. It is required to carry a discharge of of water. Find the wetted perimeter for minimum amount of lining and the required bed slope. The value of Manning’s N is given as 0.015 and it is stipulated that the average velocity cannot exceed 1 m/s. [2009/20m/6a]
3.8] Water logging and salinity
5 questions
What are the effects of waterlogging? [2026/5m/8a(ii)]
Define waterlogging. Enumerate any four causes of waterlogging. What are the effects of waterlogging? Describe any five control measures for waterlogging. [2025/15m/7c]
An open drain is to be designed to prevent waterlogging for an area of 576 ha. Given that the drainage coefficient is 0.06 m/day, determine the capacity of the drain required and the dimensions of the trapezoidal section with side slopes 1 : 1 and Lacey’s . Also, compute the slope. [2021/20m/7a]
A crop is irrigated with reclaimed waste water whose salinity () measured by electrical conductivity is 1.0 mmho/cm. If the crop is irrigated to achieve a leaching fraction of 0.20 i.e. (80% of water is lost through evapotranspiration) determine the following: (i) the salinity of the deep percolating water. (ii) the appropriate leaching fraction to maintain crop yield. The crop yield will suffer significant loss when TDS (total dissolved substance) of soil water exceeds 5000 mg/l. Given: TDS (mg/l) EC (mmho/cm) × 640. [2009/20m/6b]
In a subsurface pipe drainage system, it is desired to keep the highest level of the water table at 1.5 m below the ground surface. The depth of impervious layer from land surface is 10.0 m and the depth of the drain below the land surface is 2.0 m. The mean annual rainfall in the area is 96 cm; and the coefficient of permeability is . Design the spacing of the drain pipes. [2004/20m/8a]
3.9] Canal structures
5 questions
Draw a neat sketch of a diversion work (headwork). Briefly explain the functions of the following: (i) Silt excluder (ii) Cross regulator (iii) Canal fall (iv) Aqueduct (v) Escape. [2026/15m/7b]
Classify the following hydraulic devices based upon their mode of operation: (I) Aqueduct (II) Super passage (III) Falls (IV) Barrage/weir (V) Dams. [2026/5m/7c(ii)]
(i) Explain the difference between contour canal and side slope canal. (ii) What are the losses of water from canals? State the various factors affecting their magnitude. (iii) Propose with a sketch, a suitable cross drainage work at the location of a canal crossing a stream. Give reasons for the selection. The canal and stream data are as under: Canal data Full supply discharge = 0.45 cumec Full supply level = R.L. 300.600 Canal bed level = R.L. 300.000 Canal bed width = 2 m Stream data High flood discharge = 6 cumec High flood level = R.L. 300.500 Stream bed level = R.L. 299.400 Natural ground level = R.L. 299.500 State the characteristic features of the selected structure. [2013/20m/7a]
Explain briefly the functions, location (with/without sketch) and design considerations of the following: (i) Undersluices (ii) Fall. [2012/10m/4b(ii)]
Why are canal falls provided in irrigation channels? With the help of sketches, describe and illustrate a trapezoidal notch fall, labelling all the salient features and their functions in flow management and safety. [2004/12m/5a]
3.10] Diversion headworks
9 questions
Draw a neat sketch of a diversion work (headwork). Briefly explain the functions of the following: (i) Silt excluder (ii) Cross regulator (iii) Canal fall (iv) Aqueduct (v) Escape. [2026/15m/7b]
A weir across an alluvial river has a horizontal floor length of 50 m and retains 5 m of water under full flow condition. The downstream sheet pile is driven to a depth of 5 m below the impervious floor of negligible thickness. Determine the exit gradient. [2021/10m/5c]
An impervious floor of a weir on permeable soil is 16 m long and has sheet piles at both the ends. The upstream pile is 4 m deep and the downstream pile is 5 m deep. The weir creates a net head of 2.5 m. Neglecting the thickness of the weir floor, calculate the uplift pressures at the junction of the inner faces of the pile with the weir floor using Khosla’s theory. [2019/20m/8a]
Differentiate between a weir and a barrage. How do you decide which structure among them is needed at a site of diversion headwork? [2016/5m/8c(i)]
What are the causes of failure of weirs and their remedies? [2016/10m/8c(ii)]
Explain briefly the functions, location (with/without sketch) and design considerations of the following: (i) Undersluices (ii) Fall. [2012/10m/4b(ii)]
Explain the mutually interfering roles of post-jump height at a diversion headwork and normal depth of flow in the downstream channel. [2010/12m/5b]
Consider the following three mutually exclusive options of providing a cut-off under a weir with aprons on a permeable bed: (i) one only on the upstream end of the apron (ii) one only under the toe of the weir (iii) one only at the extreme downstream end of the apron. Sketch (illustrating all resultant effects) the possible flow net diagram in each of the three cases – showing four of the flowlines nearest to the weir-cum-cutoff construction. [2010/20m/6a]
Draw a schematic diagram (in plane view) of a barrage on an alluvial river, with provision for overflow and fish passage, for diversion of flow into a main canal, including for sediment extraction. On the diagram, label the several features and the schematic flow paths. [2004/20m/6b]
3.11] Dams
15 questions
A mass concrete dam is constructed across a river. The bed width of the river is 100.0 m. The depth of water upstream of the dam in the river is 10.0 m. The deepest foundation is at R.L. of 100.0 m. If the R.L. of the crest of spillway is 160.0 m, find: (I) Hydraulic height of the dam (II) Total height of the dam (III) Total hydrostatic force on the upstream face of the dam. [2026/10m/7c(i)]
For the gravity dam shown in the following figure, determine I. Factor of safety against sliding II. Factor of safety against overturning.
[Figure: Gravity dam section: vertical upstream face; top width 6 m; total height 30 m; water level 3 m below the top, i.e. depth of water 27 m on the upstream side. Downstream face vertical for the top 10 m, then sloping at 0.75 (horizontal) : 1.0 (vertical) over the lower 20 m to the toe (labelled “Toe”). Base width 6 m + 15 m = 21 m. Weights: (rectangular part, 6 m wide) and (triangular part, base 15 m, height 20 m).]
Take the following data: , , , [2024/8m/7c(i)]
What are spillways? Which type of spillways are provided in the following dams? (i) Bhakra-Nangal Dam (ii) Ramganga (Kalagarh) Dam (iii) Hirakud Dam (iv) Rihand Dam What forces act on a mass-concrete dam? Explain any two of these forces in detail. [2024/10m/8a(ii)]
Discuss the factors influencing the selection of site for a proposed dam. [2023/8m/7c(ii)]
Explain different modes of failure of a gravity dam with neat sketches and equations associated with different modes of failure. [2022/15m/7c]
What are the main factors that affect the selection of type of dam? [2020/15m/6b]
A dam 6 m high and 1.5 m wide at the top has vertical water face as shown in the figure below. Find the base width of the dam if no tension is to develop. Take unit weight of masonry as and uplift pressure intensity coefficient as 1. Investigate the stability of the dam if the coefficient of friction is 0.6 and maximum allowable compressive stress is :
[Figure: Trapezoidal masonry dam section: height 6 m, top width 1.5 m, base width b (unknown); upstream (water) face vertical on the left with the water surface at the top of the dam (full 6 m depth of water); downstream face sloping from the top to the downstream end of the base.] [2019/20m/7a]
What are the conditions which favour the selection of embankment dam? [2018/10m/5b]
Explain the modes of failure in gravity dam and earthen dam. [2017/5m/6b(ii)]
Explain how the water pressure is resisted by the following dams: 1. Gravity dams 2. Earth dams. [2016/2m/7b(i)]
How do you arrive the base width of an elementary profile of gravity dam? [2016/8m/7b(ii)]
Explain the reasons for cracking of concrete in concrete gravity dams and remedial measures. [2016/10m/7b(iii)]
What is Elementary Profile for a Gravity Dam? Discuss its shape and derive the expressions for its Base width and stresses in it. Design the Practical Profile of a Gravity Dam of Stone Masonry from the following data: (i) R.L. of Base of Dam : 1250 m (ii) R.L. of H.F.L. : 1280 m (iii) Specific Gravity of Masonry : 2.4 (iv) Safe Compressive Stress for Dam Material : . [2014/20m/7c]
A part of a solid gravity dam (sp. gr. of mass concrete = 2.64) is shown in its cross-section. Take uplift factor as 0.7. Draw a tabular statement for analysis of forces at a horizontal section 26 m below water level. No ice, wind or seismic forces need to be considered.
[Figure: Cross-section of the upper part of a solid gravity dam. Top width 4 m; top of the dam 2 m above the water level (W.L.) on the upstream side. Upstream face vertical from the top down to 10 m below W.L., then battered at 1 in 10 down to the horizontal section considered, which is 26 m below W.L. Downstream face vertical for 6 m from the top, then sloping at 2 (horizontal) to 3 (vertical) down to the horizontal section. Dashed lines indicate that the dam continues below the section] [2010/20m/7a]
Illustrate with the help of diagrams the basic three types of dam. Briefly mention the general design considerations to be followed for its safety. [2009/12m/5b]
3.12] Spillways and energy dissipation
13 questions
The figure shows an overflow spillway which is 40 m high. At the design energy head of 2.5 m over the spillway, determine– (i) the sequent depths; (ii) the energy loss; (iii) the percentage of initial energy lost for the hydraulic jump formed on a horizontal apron at the toe of the spillway.
[Figure: Overflow spillway of height = 40 m above the horizontal apron/river bed, with design energy head = 2.5 m above the crest (measured to the horizontal Energy Line). Flow passes over the crest and down the downstream face onto a horizontal apron. At section ① at the toe the depth is and the velocity head reaches up to the energy line; a hydraulic jump forms on the apron; at section ② downstream the depth is with velocity head ; the energy loss is shown as the drop of the energy line between ① and ②.] [2025/20m/8a]
What are spillways? Which type of spillways are provided in the following dams? (i) Bhakra-Nangal Dam (ii) Ramganga (Kalagarh) Dam (iii) Hirakud Dam (iv) Rihand Dam What forces act on a mass-concrete dam? Explain any two of these forces in detail. [2024/10m/8a(ii)]
Describe briefly different type of spillways used in dams and methods used for dissipating energy of water discharged from them. [2023/10m/8a(ii)]
Explain the function of a spillway. What are the advantages of an ogee spillway? Explain with a neat sketch. [2017/5m/6c(i)]
Compute the discharge over an ogee spillway with the following data: Head = 2 m Length = 100 m Crest is 8 m above the bottom. [2017/5m/6c(ii)]
Write a note on stilling basin and river training works. [2017/10m/6c(iii)]
Differentiate between stilling basin and cistern, and their application. [2016/7m/6c(i)]
Under what conditions is the hydraulic jump type stilling basin type-1 proposed? Explain with figure. [2016/8m/6c(ii)]
Design and sketch the shape of an ogee spillway using the data given below: Upstream head of water, H = 20 m; Shape of upstream face = 1 : 1.5 (H : V); k = 1.939, n = 1.81. [2015/15m/7a]
Give the classification of Energy Dissipators. State the situations in which Hydraulic Jump Type and Bucket Type Dissipators are recommended based on relative positions of Jump Height Curve and Tail Water Rating Curve. [2014/15m/8c]
State the circumstances under which the following types of energy dissipators will be suitable for spillways: (i) Solid roller bucket (ii) Ski-Jump bucket. [2013/10m/8b]
What are the conditions based on which the effective length of the spillway is decided? What are the various methods adopted in energy dissipation below a spillway? Explain the most suitable energy dissipation arrangements that you would recommend for each of the following conditions. (i) When Jump Height Curve (JHC) is always above Tail Water Curve (TWC). (ii) When JHC and TWC nearly coincide, and (iii) When JHC is always below TWC. [2012/20m/3c]
What are spillways? Why they are needed in the dams? Briefly describe salient features of ‘shaft’ and ‘chute’ spillways. [2011/10m/5e]
3.13] River training
8 questions
Write a note on stilling basin and river training works. [2017/10m/6c(iii)]
Explaining the objectives of river training, discuss the methods used for river training. [2015/10m/5c]
Write briefly on the suitable river training measures to be adopted for the protection of upstream side of a barrage during flood time. [2013/10m/5c]
Explain the functions of ‘spurs’ in river regulation. Also state the parameters on which design of spur depends. [2012/6m/1c(iii)]
What do you understand by term river training? What are the works that come under this category? [2011/10m/8b(i)]
Draw a sketch of a guide bank. Give its design features. [2011/10m/8b(ii)]
Write a note on river training in the context of river pollution control at river banks through a typical Indian city. [2010/10m/7c(i)]
What is meant by river training? What are its objectives? What are the in-situ features that help in this context? [2004/12m/5b]

Strengthen your GS papers
Our UPSC Mains Topic-wise & Year-wise PYQ eBook (2013–2026) maps every GS question to the syllabus, so you know what UPSC asks and how often.
View the BookDownload Free Sample« Previous: Surveying and Transportation Engineering | Next: Environmental Engineering »
Back to: Civil Engineering Optional PYQs – Topic-wise
Last updated: 30 October 2026