
Here are all 252 Demography and Psychometry questions asked in UPSC Statistics Optional Paper II from 1995 to 2026, arranged under the 5 topics of the official syllabus. Within each topic the latest questions come first.
Each question ends with a code such as [2024/15m/3b] – the year, the marks, the word limit (where UPSC set one) and the question number in the paper.
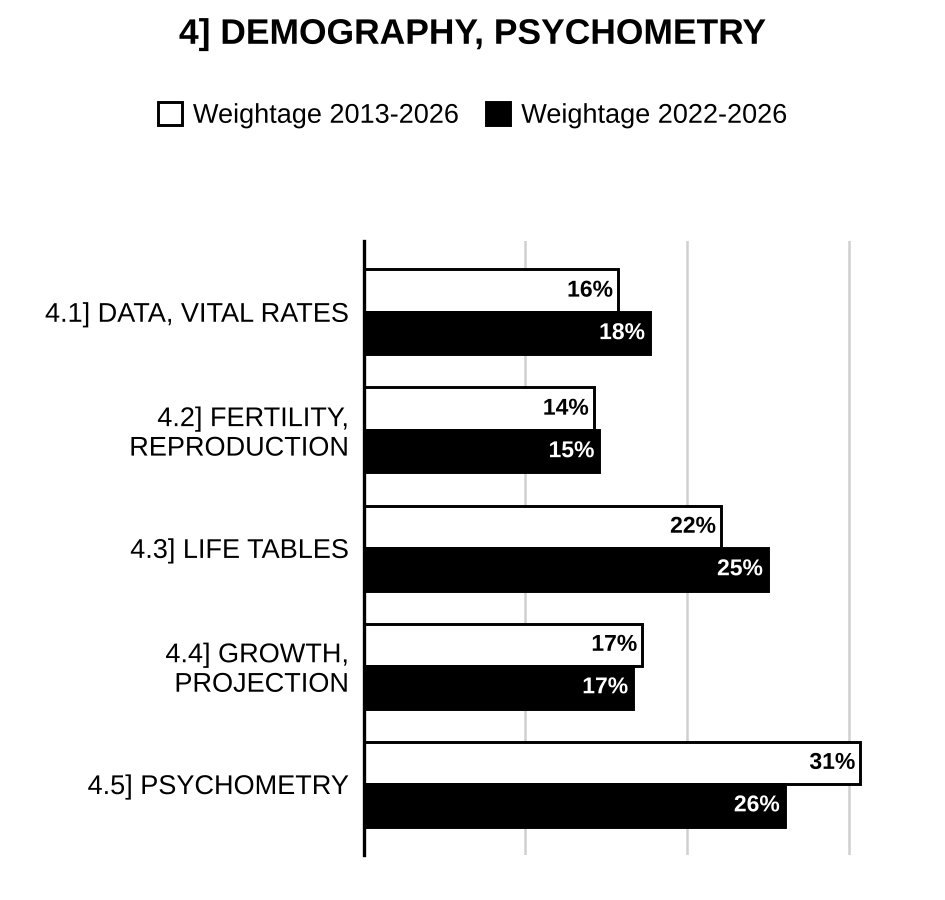
4.1] Demographic data and vital rates
49 questions
What are the usual sources of data on vital events? What types of error usually occur in census data on age? How are such errors adjusted? [2026/10m/5d]
Define Morbidity and discuss the different measures of morbidity. [2026/10m/6c(i)]
On the basis of the figures given below, calculate the age-specific death rates (ASDRs) for all the age groups. Also, calculate the crude death rate (CDR) on the basis of ASDRs:
| Age group (in years) | 0–10 | 10–30 | 30–50 | 50–70 | 70 and above |
| Population | 10000 | 18000 | 26000 | 20000 | 5000 |
| Number of deaths | 220 | 40 | 62 | 350 | 2000 |
It was later discovered that two individuals, aged 47 and 54, were incorrectly recorded as being 37 and 45, while compiling the above table. Recalculate the ASDRs and CDR based on the corrected age data. (All calculations are up to 3 decimals only.) [2025/15m/6a]
Explain why mortality situations at two places cannot be compared on the basis of crude death rates. Describe the construction of standardised death rates for this purpose. What is a comparative mortality index and how is it used? [2024/20m/7b]
Suggest which of the two measures: Morbidity Incidence rate (MIR) and Morbidity Prevalence rate (MPR) should be used to decide on the amount of medicine to be sent to a Malaria affected area. Cite an example where the other rate can be useful. [2023/10m/5e]
What are the various indices of mortality measure? Explain the purpose and procedure for standardizing them. [2022/20m/7a]
Define Crude Death Rate. Write its merits and demerits. Generally, what is the range of Crude Death Rate? Is there any relation between female CDR and male CDR? If yes, then state the relation. [2020/10m/5d]
Describe registration and census methods of demographic data collection. [2018/10m/5b]
Calculate (i) crude death rate and (ii) standardised death rates of Town from the following data:
| Age Group (in years) | Population of Town | Deaths in Town | Standard Population |
| 0–5 | 2000 | 100 | 20000 |
| 5–10 | 1600 | 48 | 16000 |
| 10–25 | 2400 | 24 | 24000 |
| 25–45 | 6000 | 30 | 60000 |
| 45 and above | 8000 | 104 | 80000 |
Are the two rates equal? If so, why? [2018/15m/7a]
Explain different measures of Mortality. [2017/10m/5d]
Define crude death rate and point out its limitations. Explain standardized death rates including the methods of their computation. [2016/10m/5a]
Explain different (i) methods of collecting census data and (ii) types of error in census data. [2015/10m/5c]
Discuss registration of vital statistics in India, stating its uses and limitations. [2015/10m/5d]
Given below is the data regarding deaths in two districts. On the basis of the given data, calculate the standardised death rates. Give your comments.
| Age Range | Population (0 0) District A | Population (0 0) District B | Number of deaths (0 0) District A | Number of deaths (0 0) District B | Age Distribution of Standard 1000 |
| 0-10 | 2000 | 1000 | 50 | 20 | 206 |
| 10-55 | 7000 | 3000 | 75 | 30 | 583 |
| 55 and above | 1000 | 2000 | 25 | 40 | 211 |
[2014/15m/6c]
What are the different measures of Mortality? Explain briefly. [2013/10m/5b]
What are Hospital Statistics? How they are useful? [2013/10m/5e]
Explain any three main sources of demographic data mentioning their limitations and uses. [2013/15m/7b]
Explain how the infant mortality rate is constructed. [2011/12m/5e]
Explain different measures of mortality. Briefly discuss about the procedures for finding standardization of rates through direct and indirect methods. [2011/15m/7c]
Explain different measures of mortality. Briefly discuss about the procedure for finding standardization of rates through direct and indirect methods. [2010/15m/7c]
Write a note on the collection, compilation and publication of demographic data by National Sample Survey Organization. [2009/12m/5d]
Discuss the differences between direct and indirect methods of standardization of death rates. Calculate the crude and standardized death rate of the year 1990 by direct and indirect methods of standardization by taking 1980 population as standard:
| Age group (years) | 1980 Population | 1980 Total deaths | 1990 Population | 1990 Age specific death rates per thousand population |
| 0 – 10 | 10000 | 240 | 15000 | 22·0 |
| 10 – 25 | 12000 | 145 | 15000 | 13·0 |
| 25 – 60 | 6000 | 92 | 8000 | 15·0 |
| 60 and above | 8000 | 480 | 9000 | 47·0 |
[2009/25m/7a]
Define Crude Death Rate (CDR) and Standardized Death Rate (STDR). Discuss which one of these two rates can be used to compare the mortality situations of two different places. [2007/20m/7a]
What are morbidity incidence rate and morbidity prevalence rate? How are they computed? Explain their uses. [2007/20m/7c]
Define (i) total fertility rate, (ii) age-specific death rate and (iii) expectation of life. [2006/12m/5e]
Explain and interpret the following: (i) Vital rates and ratios (ii) Fertility rate (iii) Morbidity rate. [2005/12m/5d]
Define and interpret the following measures: (i) Infant mortality rate (ii) Expectation of life (iii) Density of population. [2004/12m/5d]
Define crude and standardized death rates. Describe the direct and indirect methods for calculating standardized death rates. [2004/20m/7a]
Write a note on health surveys and hospital statistics. [2004/20m/7c]
What are the features of a standard population? Calculate the crude and standardized death rates using the data in the following table:
| Age group | Population (’000) | No. of deaths | Age distribution in standard population |
| 0 – 9 | 21 | 350 | 221 |
| 10 – 24 | 30 | 102 | 298 |
| 25 – 44 | 37 | 227 | 285 |
| 45 – 64 | 17 | 354 | 149 |
| 65 + | 5 | 415 [?] | 47 |
| 1000 |
[2003/20m/7b]
Write a critical note on health surveys and use of hospital statistics in India. [2002/12m/5e]
Compute the crude and standardized death rates for Population ‘A’, given the following information.
| Age group (years) | Standard population | No. of deaths | Population ‘A’ | No. of deaths |
| 0 – 10 | 600 | 9 | 400 | 12 |
| 10 – 20 | 1000 | 5 | 1500 | 6 |
| 20 – 60 | 3000 | 24 | 2400 | 20 |
| Above 60 | 400 | 20 | 700 | 25 |
Interpret the results. [2001/20m/7c]
Explain the problems in developing rates for morbidity. Also define crude and specific morbidity prevalence rates. [2000/12m/5e]
Explain how the infant mortality rate is constructed. [2000/10m/7b]
Discuss the sources, uses and limitations of demographic data in India. [1999/20m/13a]
Define the following rates and explain their uses: (i) Infant mortality rate (ii) Crude death rate (iii) Standardized death rate. [1999/20m/13b]
Morbidity and its Measurement. [1999/20m/16b]
Explain why the mortality situation of two places cannot usually be compared on the basis of crude death rates. Describe the construction of standardized death rates for this purpose. [1998/20m/17a]
Write a note on the importance of vital statistics for demographic purposes. [1998/20m/17c]
Give a brief account of the National Sample Survey in the field of demography and show how far the finding have been useful in preparation of Five Year Plans in this respect. [1998/20m/19c]
What are the sources of demographic data in India? Explain and compare the population register and population census a sources of demographic data. [1997/20m/17a]
Define and compare infant death rate and infant mortality rate (IMR). Also explain how IMR is determined from death statistics. [1997/20m/17b]
Morbidity and its measures. [1997/20m/20a]
Health Surveys. [1997/20m/20b]
Standardisation of vital rates. [1997/20m/20c]
Define the following and explain their uses: (i) Density and proximity of population (ii) Infant mortality rate (iii) Net reproduction rate. [1996/20m/17a]
Explain the direct method of standardising death rates. [1996/20m/18c]
Define the following rates: (i) Infant mortality rate (ii) Crude death rate (iii) Standardised death rate Explain how these are useful in the measurement of mortality. [1995/20m/17a]
Write a note on the use of hospital statistics and their limitations. [1995/20m/18c]
4.2] Fertility and reproduction
27 questions
Compute the Age-specific Fertility Rate, the Total Fertility Rate, and the Gross Reproduction Rate, from the data given below:
| Age group of child-bearing females | No. of women (’000) | Total Births |
| 15 – 19 | 16·0 | 260 |
| 20 – 24 | 16·4 | 2244 |
| 25 – 29 | 15·8 | 1894 |
| 30 – 34 | 15·2 | 1320 |
| 35 – 39 | 14·8 | 916 |
| 40 – 44 | 15·0 | 280 |
| 45 – 49 | 14·5 | 145 |
Assume that the proportion of female births is 46·2 percent. [2026/10m/7b(i)]
Define “Reproduction Rates”, and explain how far they may be looked upon as indices of population growth. [2026/5m/7b(ii)]
Establish the relationship among crude birthrate, general fertility rate and total fertility rate in the context of continuous data. Also, mention the properties of these fertility rates. [2025/10m/5b]
Define Crude Birth Rate, General Fertility Rate and Age-specific Fertility Rate and indicate why each is considered an improvement on the preceding measure of fertility. Define Total Fertility Rate and its utility. [2024/15m/8b]
Distinguish between GFR and TFR. What is meant by TFR = 3.29? Discuss the merits and demerits of TFR. Construct the relationship between GRR and TFR. Interpret GRR when GRR >1, <1 or =1. [2023/15m/8b]
In what way do total fertility rate (TFR), gross reproduction rate (GRR) and net reproduction rate (NRR) differ from one another as a measure of reproduction? [2022/15m/7c]
If denote observed proportion of females in the age group and is the observed proportion of females giving birth to female children in the age group at time . Let us assume that is uniformly distributed in . Then show that where is the estimated total fertility. is the estimated female birthrate at time . is the estimated General Fertility rate. represents product moment correlation coefficient between and given . are observed standard deviations of and respectively. [2021/15m/7a]
Calculate gross and net reproduction rates from the following data considering sex ratio at birth to be 105 males to 100 females:
| Age (in years) | Age-Specific Fertility Rate | Female Life Table Stationary Population |
| 15–19 | 0.0696 | 4180 |
| 20–24 | 0.2346 | 4123 |
| 25–29 | 0.1897 | 4063 |
| 30–34 | 0.1143 | 4001 |
| 35–39 | 0.0611 | 3934 |
| 40–44 | 0.0285 | 3860 |
| 45–49 | 0.0101 | 3763 |
[2020/10m/5e]
Explain different measures of fertility. From the following data, calculate the female gross reproduction rate if the ratio of male and female children be :
| Age group | No. of children born to 1000 women |
| 15–19 | 50 |
| 20–24 | 180 |
| 25–29 | 200 |
| 30–34 | 150 |
| 35–39 | 80 |
| 40–44 | 40 |
| 45–49 | 10 |
[2019/15m/8c]
The sex-wise distribution of population and number of births along with survival rates of a town in 2011 are given below:
| Age group | Population Male | Population Female | Population Total | Births Male | Births Female | Births Total | Survival rates |
| 15-19 | 6145 | 5687 | 11832 | 65 | 60 | 125 | 0.91 |
| 20-24 | 5214 | 5324 | 10538 | 144 | 132 | 276 | 0.90 |
| 25-29 | 4655 | 4720 | 9375 | 135 | 127 | 262 | 0.89 |
| 30-34 | 3910 | 3933 | 7843 | 82 | 81 | 163 | 0.87 |
| 35-39 | 3600 | 3670 | 7270 | 62 | 56 | 118 | 0.85 |
| 40-44 | 3290 | 3025 | 6315 | 12 | 15 | 27 | 0.83 |
| 45-49 | 2793 | 2601 | 5394 | 3 | 3 | 6 | 0.82 |
| Total | 29607 | 28960 | 58567 | 503 | 474 | 977 |
Find (i) General Fertility Rate (GFR) (ii) Age Specific Fertility Rate (ASFR) (iii) Total Fertility Rate (TFR) (iv) Gross Reproduction Rate (GRR) and (v) Net Reproduction Rate (NRR) [2017/20m/6b]
Compute Age Specific Fertility Rate (ASFR) and Total Fertility Rate (TFR) from the following table:
| Age group (in years) | Female population (’000) | No. of live births |
| 15–19 | 200.6 | 4227 |
| 20–24 | 173.5 | 26099 |
| 25–29 | 161.7 | 32844 |
| 30–34 | 160.9 | 23449 |
| 35–39 | 155.7 | 11588 |
| 40–44 | 125.6 | 2071 |
| 45–49 | 87.6 | 122 |
[2015/15m/7a]
The following table gives the number of female births classified by age of mothers and survival rates of mothers:
| Age of mothers (in years) | Female population (’00) | No. of female live births (’00) | Survival rate (per 100000) |
| 15–19 | 157670 | 4632 | 58065 |
| 20–24 | 147624 | 14443 | 55870 |
| 25–29 | 124200 | 14058 | 52981 |
| 30–34 | 105865 | 8329 | 48963 |
| 35–39 | 89264 | 4036 | 44146 |
| 40–44 | 77887 | 2158 | 39154 |
| 45–49 | 61161 | 689 | 34198 |
Compute Gross Reproduction Rate (GRR) and Net Reproduction Rate (NRR), and draw your conclusion. [2015/20m/8a]
Why the gross reproduction rate (GRR) and net reproduction rate (NRR) are considered as refined measures of fertility? Assuming that the ratio of female babies to total birth is 48.8 per cent, compute the gross reproduction rate for the following data:
| Age group | 16-20 | 21-25 | 26-30 | 31-35 | 36-40 | 41-45 | 46-50 |
| Fertility rate per thousand women | 19 | 173 | 253 | 201 | 157 | 67 | 9 |
[2014/10m/5e]
Clearly explain the following fertility rates and also give their advantages and disadvantages: (i) Crude Birth Rate (ii) General Fertility Rate and (iii) Age Specific Fertility Rates. [2013/15m/8a]
Differentiate between total fertility rate (TFR), gross reproduction rate (GRR) and net reproduction rate (NRR). Does TFR strictly conform to our idea of a measure for reproduction? How does NRR indicate the growth of population? [2009/12m/5c]
Define (i) total fertility rate, (ii) age-specific death rate and (iii) expectation of life. [2006/12m/5e]
Define gross and net reproduction rates. Explain the computation of net reproduction rates. Interpret its value being less than, equal to or greater than unity. [2006/20m/7a]
Explain and interpret the following: (i) Vital rates and ratios (ii) Fertility rate (iii) Morbidity rate. [2005/12m/5d]
Define general fertility rate (GFR) and age specific fertility rate (ASFR). Describe the methods for calculating these fertility rates. Also indicate why ASFR is considered as an improvement over GFR. [2005/20m/7c]
Explain why crude birth rate does not measure the fertility of a population Describe general fertility rate, age specific fertility rate and total fertility rate. Why is the total fertility rate independent of the age distribution in the population? [2003/20m/7c]
Explain how the crude birth rate, general fertility rate, age-specific fertility rate and total fertility rate are measured. [2002/15m/7a]
Define net reproduction rate. How is this rate constructed and interpreted? [2001/12m/5d]
Explain the construction of net reproduction rate. Interpret its value when it is less than, equal to or greater than unity. [1999/20m/13c]
Explain gross and net reproduction rates. What interpretation will you give if the net reproduction rate is just 1, less than 1 or greater than 1? [1998/20m/18b]
Define Gross and Net reproduction rates. Explain their uses and how to compute them. [1997/20m/18b]
Define the following and explain their uses: (i) Density and proximity of population (ii) Infant mortality rate (iii) Net reproduction rate. [1996/20m/17a]
State and interpret the balancing equation in the study of a human population. Define and explain any two important measures of fertility. [1995/20m/18a]

Preparing for Prelims too?
Our UPSC Prelims Topic-wise PYQ eBook covers every Prelims question with detailed explanations, so you can see exactly where UPSC asks from.
View the BookDownload Free Sample4.3] Life tables
43 questions
Define a life table and mention its uses. [2026/5m/7a(i)]
The number of persons dying at age 75 is 476, and the complete expectations of life at ages 75 and 76 years are 3·92 and 3·66 years, respectively. Find the number of persons living at ages 75 and 76 years. [2026/10m/7a(ii)]
Given and:
| : | 91 | 92 | 93 | 94 | 95 | 96 | 97 | 98 | 99 | 100 | 101 |
| : | 296 | 209 | 144 | 93 | 58 | 34 | 18 | 10 | 5 | 3 | 1 |
where and have their usual meanings as in a life table, find the probability that: (i) a person aged 93 will die within three years. (ii) a person aged 92 will survive up to age 96. (iii) three persons aged 92, 93 and 94 will survive 4 years. (iv) of three persons aged 93, 94 and 95, exactly two of the three will be alive in 4 years. (v) all the three persons aged 93, 94 and 95 will die in 4 years. [2026/15m/8b]
Prepare a life table for an age group from age 50 to age 60 of a specific population. Assume that there are 10000 persons living at age 50 and the probability of death within age to is given as for . Prepare the life table with columns , , , and for . [2025/20m/6c]
(i) Determine the average age at death of those who die between ages and . (ii) If find exactly using appropriate method. [2024/10m/5d]
Derive, by starting from a suitable functional form for , the formula (i) and (ii) (iii) where = members of the cohort alive at age = number of years lived, in the aggregate, by the cohort of persons between age and = number of persons dying between age and = probability that a person of age will survive till age = expectation of life at age [2023/15m/7a]
On the life table with , Find (i) the chance that a child who has reached age 5 will live to age 60. (ii) the chance that a man of age 30 will live until age 80. (iii) the probability of dying within 5 years for a man aged 40. (iv) the expectation of life at age 40. (v) the chance that of the three men aged 30 at least one survives till age 80. [2023/20m/7c]
If the survivorship function in life table is linear between and , and complete expectations of life at ages 40 and 41 for a particular group of persons are 21.39 years and 20.91 years respectively and , find the number of persons that attain the age 41. [2022/10m/5d]
If is the average number of complete years of life lived by each of persons in life table population after attaining age , and is the probability of dying within one year following the attainment of age , prove that [2022/15m/8c]
.
| Age | ||||||||
| 30 | 762227 | ? | ? | ? | ? | 27296632 | ? | ? |
| 31 | 758580 | – | – | – | – | ? | ? | – |
Fill in blanks which are marked with a query in the above skeleton life table and explain the meaning of the symbols at the heads of the columns. [2021/10m/5e]
Define instantaneous force of mortality . Show that where is the probability of dying within one year following the attainment of age . Also prove that where is the complete expectation of life. [2021/20m/7c]
Differentiate between a complete life table and an abridged life table. Explain the terms involved in life table. In a sample survey of a locality, the number of males of ages 45 and 46 were 30450 and 30320 respectively. Calculate . [2020/15m/7a]
Given that the complete expectations of life at ages 30 and 31 for a particular group are respectively 27.49 years and 22.56 years, and that the number of living at age 30 is 54435. Find (i) the number that attains the age 31 and (ii) the number that will die without attaining the age 31. [2019/10m/5d]
What is life table? State the assumptions and explain the elements of life table. State the principal methods used for the construction of abridged life table. Discuss any one of them. [2019/15m/6c]
What is a life table? Distinguish between a complete life table and an abridged life table. Complete the following life table:
| 83 | 3560 | ? | 0.16 | ? | ? | ? |
| 84 | ? | ? | 0.17 | ? | 11975 | ? |
[2018/20m/8b]
Complete the following life table of the population of a certain type of insects, being age in days and :
| 0 | 1 | 2 | 3 | 4 | 5 | 6 | 7 | 8 | |
| 0.12 | 0.005 | 0.01 | 0.05 | 0.1 | 0.5 | 0.8 | 0.9 | 0.95 |
[2017/20m/8a]
What is a life table? Stating the assumptions involved, explain the elements of a life table. Given the following table for , the number of rabbits at age , complete the life table for rabbits:
| 0 | 1 | 2 | 3 | 4 | 5 | 6 | |
| 100 | 90 | 80 | 75 | 60 | 30 | 0 |
[2016/20m/8a]
Fill in the blanks in a portion of the life table given below:
| Age in years | |||||||
| 4 | 95000 | 500 | ? | ? | ? | 4850300 | ? |
| 5 | ? | 400 | ? | ? | ? | ? | ? |
[2014/20m/6a]
Complete the following Table:
| Age in years | |||||||
| 11 | 12000 | ? | ? | ? | ? | ? | ? |
| 12 | 8000 | ? | ? | ? | ? | ? | ? |
| 13 | 6000 | ? | ? | ? | ? | ? | ? |
| 14 | 4000 | 3000 | ? | ? |
[2013/25m/6a]
Distinguish between an abridged life table and a complete life table. Discuss a method of constructing abridged life table. [2012/15m/8b]
With usual notation show that (i) (ii) (iii) [2010/15m/8c]
What do you mean by a life table? The values of in a life table are given as follows:
| age | 102 | 103 | 104 | 105 | 106 | 107 | 108 |
| 97 | 59 | 32 | 15 | 6 | 2 | 0 |
Calculate remaining entries of the life table for and find the probability that a person of exact age 102 years will die between ages 103 and 107. [2009/12m/5e]
Prove the following: (i) (ii) (iii) [2009/20m/8a]
Distinguish between complete and abridged life tables. [2007/12m/5d]
Define complete expectation of life () and curtate expectation of life (). Show that . Also comment on the nature of as a function of x. [2007/12m/5e]
State the basic assumptions while constructing a life table. In the usual notations, show that What is an abridged life table? [2006/20m/7b]
Derive Makeham’s law stating clearly the underlying assumptions. Also explain how the constants in the Makeham’s law can be ascertained from four equidistant values of . [2005/20m/7a]
Define and interpret the following measures: (i) Infant mortality rate (ii) Expectation of life (iii) Density of population. [2004/12m/5d]
Explain the various columns of a life table giving the relationship between them. What is an abridged life table? [2004/20m/7b]
Explain the concept of force of mortality at age x. Express it in terms of and its derivative. Can be decomposed into several cause specific forces (in a multiple decrement life table)? [2003/12m/5d]
Explain the terms and appearing in a life table. How are these related to and appearing in an abridged life table? Is such modification required for and also? [2003/20m/7a]
What are abridged life tables? How does an abridged life table differ from a complete life table? Explain Greville’s method of constructing abridged life table. [2002/25m/7b]
Explain the basic assumptions while constructing a life table. In usual notations, prove What are the uses of a life table? [2001/20m/7b]
What is a complete life table? Explain how such a table is constructed. [2000/25m/7a]
Explain a method of constructing a life-table. What are the uses of a life-table? [1999/20m/14a]
What is meant by force of mortality at age x? Derive Makeham’s formula starting from suitable assumptions. [1998/20m/18a]
Describe the structure of a complete life table. [1998/20m/18c]
Describe a suitable method of constructing an abridged life table. [1998/20m/19a]
What is an abridged life table? Explain the nature, need and Kings method of construction of such tables. [1997/20m/17c]
Force of mortality and its evaluation. [1997/20m/20d]
Stating the underlying assumptions, outline the construction of a life-table. [1996/20m/17b]
In the usual notation show in the setup of a life-table. [1996/20m/17c]
Explain the terms: (i) A life table (ii) An abridged life table How is an abridged life table constructed? [1995/20m/17b]
4.4] Population growth and projection
45 questions
Explain stable population. Prove that the proportion of population at any age ‘’ and time ‘’, denoted by is independent of time under a stable population, i.e., . [2026/10m/6c(ii)]
What are the implications of using stable versus quasi-stable population assumption in demographic modelling? [2025/10m/5c]
The population growth of a city is modelled using logistic growth model with a carrying capacity of . The population data (in thousands) is provided at 2-year intervals from 2014 (taken as ) to 2024 :
| Year | 0 | 2 | 4 | 6 | 8 | 10 |
| Population (in 1000s) | 1000 | 1785 | 2575 | 3400 | 4900 | 6200 |
(i) Estimate the two parameters of the logistic growth model. (ii) Using the estimated model, project the population of the city for the year 2026. [2025/20m/7b]
Distinguish between population estimates and population projections. Briefly describe the component method of population projection. [2024/15m/6c]
The rate of increase of a population at time is . If the population totals 1,000,000 at time , what is the population at ? [2023/10m/5d]
With usual notations, obtain logistic curve as given by for population growth model. Also discuss its any three properties. [2022/15m/7b]
Describe Leslie matrix and describe Leslie Matrix Technique for the population projection. [2021/15m/8c]
Discuss in detail Gompertz curve for population growth and explain the method of its fitting. [2020/15m/7b]
Explain logistic curve for population projection. Describe any one method for fitting logistic curve to the population data. [2020/15m/8b]
Distinguish between stable and stationary populations. [2017/10m/5a]
What is logistic curve? Explain the method of three selected points for fitting the logistic curve to a population data. [2017/15m/7c]
What do you understand by population projection using mathematical methods? Discuss the Pearl and Reed method of fitting a Logistic curve to a set of data for population projection. [2016/15m/6a]
Explain the method of population projection using logistic curve. State its limitations. [2015/15m/7b]
Describe a method of fitting trend by logistic curve. [2014/10m/5d]
What do you mean by stable and quasi-stable populations? Stating the basic assumptions of stable population theory, derive three basic equations which provide information about the intrinsic growth rate, birth rate and age distribution of the population. [2014/20m/8b]
Explain the Logistic growth curve for the population growth. Give any two methods of fitting the Logistic Growth Curve. [2013/15m/6b]
Explain how Fertility can be estimated as an application of Stable Population Theory. [2013/10m/8b]
What is the Logistic curve? Describe in detail the method of Pearl and Reed and also Rhodes’ method for fitting a logistic curve to population data. [2012/30m/7a]
Define and describe quasi-stable theory of population. [2011/12m/5b]
Explain Quasi Stable theory of Population. [2010/12m/5c]
Define a logistic curve and examine its suitability as a growth model. Describe Rhodes’s Method of fit a logistic curve. [2007/20m/7b]
Distinguish clearly between stable and stationary populations. [2006/12m/5d]
State the main features of a logistic curve and explain its suitability as a growth model. How is this curve fitted to observed data? [2006/20m/7c]
How are population projections made? [2005/12m/5e]
What are the uses of stable and quasi-stable population techniques in estimation of demographic parameters? [2005/20m/7b]
Define a logistic curve and examine its suitability as a growth model. [2004/12m/5e]
What do you mean by population projection? Discuss the component method of population projection. [2002/12m/5d]
Explain Rhodes method of fitting a logistic curve to the census population data of a country. [2002/20m/7c]
Examine the use of stable population concept in estimation of demographic parameters. [2001/12m/5e]
Project the logistic curve as a model of human population growth and discuss its limitations. [2001/20m/7a]
A population grows in such a manner that is a linear function of log P(t) where P(t) is the population size at time t. Obtain the explicit expression for P(t) and state its properties. [2000/12m/5d]
What are stable and quasi-stable populations? Derive Lotka’s equation in this context and explain its utility. [2000/25m/7c]
Explain the use of stable population technique in the estimation of demographic parameters. [1999/20m/14b]
Examine Gompertz curve as a growth model. [1999/20m/14c]
What factors govern the growth of population? How do you find out whether the population of a country is increasing or decreasing or remaining stationary? [1998/20m/17b]
Describe briefly the component method for population projection mentioning the demographic data which will be required for this purpose. [1998/20m/19b]
Stating the underlying assumptions, derive the Logistic growth model. Also state the main features of the model. [1997/20m/18a]
What do you understand by stable and quasi-stable populations? Derive Lotka’s equation linking the intrinsic rate of growth with the age structure of a stable population. Hence, show that under neutral change in mortality by age to age distribution of a stable population does not change. [1997/20m/18c]
Examine Gompertz curve as a growth model. [1996/20m/18a]
Describe stable and quasi-stable population models. How are these models useful for estimating demographic parameters? [1996/20m/18b]
Logistic curve. [1996/20m/20c]
Balancing equation in population studies. [1996/20m/20d]
Describe a logistic growth model. How is this fitted to actual data? [1995/20m/17c]
State and interpret the balancing equation in the study of a human population. Define and explain any two important measures of fertility. [1995/20m/18a]
Explain the concept of a stable population. How is this useful in population studies? [1995/20m/18b]
4.5] Psychometry
88 questions
Why is it considered desirable to convert raw scores to standard scores? Below is given the distribution of test scores of 62 children:
| Test Score: | 10 | 9 | 8 | 7 | 6 | 5 | 4 | 3 |
| f: | 1 | 4 | 6 | 10 | 8 | 13 | 18 | 2 |
Obtain standard scores with mean 50 and standard deviation 10. [2026/10m/5e]
Explain the use of parallel tests in psychological studies. [2026/5m/8c(i)]
Explain how you will combine the ranks of a number of subjects given by several judges. [2026/10m/8c(ii)]
What does it imply by validity of a test? Distinguish between the concepts of validity and reliability. [2025/10m/5e]
The marks obtained by student in Mathematics and Language tests of maximum marks 150 each are 120 and 105 respectively. Find out in which subject, student is more able as compared to other students based on the measure of score. The following table gives a sample of marks obtained by 15 students of the same class:
| Score in Mathematics | Score in Language |
| 100 | 67 |
| 75 | 63 |
| 88 | 73 |
| 85 | 77 |
| 92 | 60 |
| 94 | 53 |
| 93 | 50 |
| 84 | 48 |
| 67 | 38 |
| 96 | 73 |
| 100 | 36 |
| 102 | 45 |
| 94 | 47 |
| 73 | 39 |
| 83 | 56 |
[2025/15m/8b]
What are intelligence tests and how are they used in measuring intelligence? Define the terms mental age and IQ in this connection. [2024/10m/5e]
Define reliability of a test. What is the effect of test length on the reliability of a test? [2024/5m/7c(i)]
Give different methods for estimating the reliability of a psychological test. [2024/10m/7c(ii)]
Four items are to be constructed so that they are equispaced on the difficulty scale. If the easiest item is passed by 85% of the group and the most difficult by 25%, find the percentage of individuals in the group passing the other two items. (Standard Normal tables are provided) [2024/15m/8a]
What do you mean by reliability and validity of tests? What is the difference between reliability and validity of a test? If the reliability of a test is raised from 0.80 to 0.90 by lengthening the test, a validity coefficient of 0.60 for this test would be expected to increase to what value? [2023/10m/5c]
(i) 400 students are given a test. The average is 60 and the standard deviation is 12. Obtain the -score and the standard scores equivalent to raw scores. The raw scores are given by.
| Raw scores | 84 | 78 | 72 | 66 | 60 | 54 | 48 | 42 | 36 |
(ii) Convert the ten scores 1, 2, …, 10 into standard scores with mean 50 and standard deviation 10. [2023/15m/7b]
Compute the -scores corresponding to test score for the following frequency distribution:
| 1 | 2 | 3 | 4 | 5 | |
| 2 | 3 | 8 | 6 | 1 |
(Cumulative Normal Distribution Table is given in Page No. 9) [2022/10m/5e]
Why is it considered desirable to convert gross scores to some standard scores? Define ‘standard scores’ and ‘normalised scores’ and describe how they are derived. [2021/10m/5d]
What do you mean by Intelligence Quotient (I.Q.)? Describe the procedure and test of measuring I.Q. How does an aptitude test differ from an Intelligence Test? The reliability coefficient of a test of 60 items is 0.65. How much the test should be lengthened to raise the self correlation to 0.95? What effect will the doubling and tripling the test’s length have upon the reliability coefficients? What is the reliability of a test having 135 comparable items? [2021/15m/7b]
Explain the concept of validity of a test. Describe various types of validity. [2020/10m/5a]
What do you understand by scaling of test items? What are raw scores, standard scores and scores? Explain. In a behavioural study on a group of students with mean 86 and standard deviation 15, Ram scored 91 and Shyam scored 83. Express these raw scores as standard scores with mean 500 and standard deviation 100. [2020/20m/7c]
Define -score. Write its applications. Find the -scores corresponding to the test scores for the following frequency distribution:
| 1 | 2 | 3 | 4 | 5 | 6 | 7 | |
| 5 | 10 | 20 | 5 | 4 | 4 | 2 |
(Normal Distribution Table is given in Page No. 11.) [2019/10m/5e]
4 items are to be constructed so that they are equispaced on the difficulty scale. If the easiest item is passed by 85% of the group and the most difficult by 25%, find the percentage of individuals in the group passing the other two items. (Normal Table of Area is given in Page No. 11.) [2019/15m/7b]
Explain the concept of reliability and validity of scores in education and psychology. Describe the methods of obtaining the reliability coefficient and the validity coefficient. [2019/15m/7c]
Discuss the importance of scaling in scores in psychometry. Describe any two scaling methods. [2018/10m/5e]
Discuss the concept of reliability of a test. Define reliability ratio of a test and show that it is always between 0 and 1. What is the index of reliability? Is it also bounded by 0 and 1? [2018/20m/6c]
Suppose there are four items , , and respectively passed by 90%, 80%, 70% and 60% of individuals. Compare the differences in difficulty between and with the differences in difficulty between and . [2018/15m/7b]
What is -score, Standard score and Normalised score in psychological statistics? [2017/10m/5e]
What is Reliability of Test Scores? Explain Test-Retest method and parallel forms method of determining test Reliability mentioning their merits and limitations. [2017/15m/6c]
What is the problem of scaling? Describe z-scaling and t-scaling. [2016/10m/5b]
Explain briefly the concepts of reliability and validity of scores in educational and psychological experiments. Describe a method of obtaining the reliability coefficient and the validity coefficient. [2016/15m/8c]
Explain clearly the term ‘scaling’ as used in the problems of scholastic achievement. How does this scale differ from ordinary metre scale? [2015/10m/5e]
Obtain the general Spearman-Brown formula and explain how it is used for estimating reliability by the split-half method. What is the effect of increasing the length of a perfectly reliable test on reliability? [2015/20m/7c]
What is the difficulty in ranking individuals on the basis of total of raw scores on different tests? How to overcome this difficulty? Explain linear derived scores in this connection. [2015/15m/8b]
What is validity of Test Scores? How you will calculate validity? Also make comparison with the concept of reliability. [2014/10m/5b]
What is meant by intelligence quotient (I.Q.)? Describe the procedure and tests for measuring it. [2014/15m/7b]
Explain the terms (i) summation score as a function of ability (ii) percentile scores (iii) Z-score. Describe how T-scores are to be found when we are given test scores in the form of a frequency table. [2014/15m/8c]
What is Validity of Test Scores? How you will calculate Validity? Also make comparison with the concept of reliability. [2013/10m/5d]
What is the percentile score of a student in a test? Suppose that the original scores of the student in a test are approximately normally distributed. Then what will be the mean and the variance of the percentile scores? [2012/12m/5e]
Give a brief outline of factor analysis and discuss its importance in Psychometric studies. [2012/15m/8a]
What is reliability of test scores and how is it determined? [2012/15m/8c]
Explain briefly the concept of path analysis. Mention their uses in Psychometry. [2010/12m/5f]
Explain the concept of Validity. How one can estimate the Validity? Explain what are the different types of validity? Also discuss the concept of test length with respect to validity. [2010/20m/6a]
A given test has a reliability coefficient of 0·8 and standard deviation of 20. (i) What is the maximum correlation which this test is capable of yielding as it stands? (ii) What is the S.E. of a score obtained on this test. (iii) What is the estimated reliability coefficient of this test in a group in which standard deviation is 15? (iv) What proportion of the variance of the scores in this test is attributable to “true” variance? [2010/20m/7b]
What is the effect of lengthening of a test on its (i) reliability and (ii) validity? A given test has a reliability coefficient of 0·8 and standard deviation 20. What is the estimated reliability coefficient of this test in a group in which standard deviation is 15? [2009/12m/1e]
Explain clearly the concepts of reliability and validity of scores in psychological and educational experiments. Explain the relation of validity coefficient to error of measurement. [2009/12m/5f]
Explain the terms (i) percentile score, (ii) summation score as a function of ability, (iii) Z-score and (iv) T-score. Describe how T-scores are to be found when we are given test scores in the form of a frequency table. [2009/20m/6c]
Describe the test-retest method for estimating the reliability of a test and discuss its merits and demerits. [2009/10m/8c]
What is path analysis? Explain its use in psychometry. [2007/12m/5f]
Define T-scores and percentile scores. Describe why they are used and how these are computed. [2007/15m/8c]
What is reliability coefficient of a test? Describe some practical methods of estimating test reliability. [2007/15m/8d]
Define T-scores. Explain the method of computing T-scores from raw test scores. [2006/12m/5f]
What is meant by intelligence quotient (IQ)? Describe the procedure and tests for measuring IQ. [2006/15m/8c]
Describe the following methods of determining the reliability of test scores: (i) Split–half technique (ii) Rational equivalence. [2006/15m/8d]
Explain the use of factor analysis in psychometry. [2005/12m/5f]
Explain the different methods of combining and comparing scores in several tests, stating clearly the assumptions made in each case. [2005/15m/8c]
What are intelligence tests and how are they used in measuring intelligence? [2005/15m/8d]
What is the ‘validity’ of a test? How is it measured? [2004/12m/5f]
Why is it considered desirable to convert given raw scores into some standard scores? Define ‘standardized scores’ and ‘normalized scores’, and describe how these are derived. [2004/15m/8c]
Describe any two methods commonly used for computing the ‘reliability’ coefficient of a test. What is the effect of lengthening of a test on its reliability? [2004/15m/8d]
Define ‘intelligence quotient’. What are the salient features of the ‘Stanford-Binet’ test? Is ‘Finding Reasons’ a component of the test at all ages? [2003/12m/5f]
What are standard scores? Why are they used instead of raw scores for further analysis? Describe and explain the difference between Z-scores and T-scores. [2003/20m/8b]
What are the aspects of human behaviour to which psychological tests correspond? Discuss how one check does whether a test is valid for measuring these aspects. [2003/20m/8d]
What do you mean by intelligence quotient? How is it measured? What are its uses? [2002/12m/5f]
Explain the term ‘validity’. Also, explain briefly the four types of validity concepts. [2002/15m/8c]
Describe the uses of factor analysis and path analysis in Psychometry. [2002/15m/8d]
What is test reliability? Describe a method of measuring reliability of a test. [2001/12m/5f]
Outline an application of factor analysis. [2001/15m/8a]
What is intelligence quotient and how is it constructed? [2001/15m/8c]
What is intelligence quotient? How is it constructed? [2000/12m/5f]
Explain the utility of -scores and standard scores in analyzing psychological data. State the assumptions under which they are obtained. Under what conditions will these scores be equal? [2000/15m/8c]
Explain factor analysis and its uses in psychological investigations. [2000/15m/8d]
Define a T-score. Explain the method of computing T-scores from raw test scores. [1999/20m/15a]
Illustrate the need for scaling of test scores. Define (i) a standard score, and (ii) a percentile score. [1999/20m/15b]
Explain the concept of validity of test scores. How is it determined? [1999/20m/15c]
Intelligence Quotient Tests. [1999/20m/16a]
Use of factor analysis in psychometry. [1999/20m/16c]
Why is it considered desirable to convert raw scores to some standard scores? Define ‘standardized scores’ and ‘normalized scores’ and describe how they are derived. [1998/20m/20a]
Explain the term Intelligence Quotient (IQ). Describe any method of measuring it. [1998/20m/20b]
Discuss the various methods to determine the reliability of test scores. [1998/20m/20c]
Explain the following terms (i) -scores (ii) standard scores, and (iii) T-scores Also explain how to get T-scores if the test scores are in the form of a frequency table. [1997/20m/19a]
Define reliability of a test. Also explain the methods of determining the reliability of tests. [1997/20m/19b]
What do you understand by intelligence quotient? How is it measured? How is the validity of an intelligence test generally determined? [1997/20m/19c]
What is test reliability? How is this measured? Describe one method fully. [1996/20m/19a]
Examine the effect of lengthening and repeating a test on test reliability. [1996/20m/19b]
A test with 40 items has a reliability coefficient of 0.68. What is the reliability of a comparable test with (i) 80 items, (ii) 100 items? [1996/20m/19c]
IQ tests. [1996/20m/20b]
Illustrate the need for scaling of tests. Define (i) a standard score, and (ii) a T-score. [1995/20m/19a]
Given a distribution of scores with mean 86 and and the raw scores of Gautham and Gopi as 91 and 83, express these as standard scores in a distribution with a mean of 500 and of 100. [1995/20m/19b]
Explain and illustrate percentile scaling. [1995/20m/19c]
Describe the following methods for determining the reliability of test scores (i) Test-retest (ii) Alternate or parallel forms. [1995/20m/20a]
Examine in detail the effect of lengthening or repeating a test upon test reliability. [1995/20m/20b]
A test of 50 items has a reliability coefficient of 0.78. What is the reliability coefficient of a test (i) having 100 items comparable to those of the original test? (ii) having 125 items comparable to those of the original test? Comment on the results obtained. [1995/20m/20c]

Strengthen your GS papers
Our UPSC Mains Topic-wise & Year-wise PYQ eBook (2013–2026) maps every GS question to the syllabus, so you know what UPSC asks and how often.
View the BookDownload Free Sample« Previous: Quantitative Economics and Official Statistics
Back to: Statistics Optional PYQs – Topic-wise | Also see: Statistics Optional year-wise question papers
Last updated: 31 October 2026