
Statistics Optional PYQs Topic-wise for UPSC Mains (1995–2026) are listed below unit by unit, in the order of the official syllabus – 2082 questions in all. Click any unit to open all its previous year questions, arranged topic-wise with the latest first.
Want full papers instead? Open the Statistics Optional year-wise question papers for Paper I and Paper II.
Paper I
| Unit | Topic (click to open PYQs) | Sub-topics | Questions | Link |
|---|---|---|---|---|
| 1 | Probability | 6 | 267 | Click here → |
| 2 | Statistical Inference | 8 | 271 | Click here → |
| 3 | Linear Inference and Multivariate Analysis | 7 | 218 | Click here → |
| 4 | Sampling Theory and Design of Experiments | 10 | 290 | Click here → |
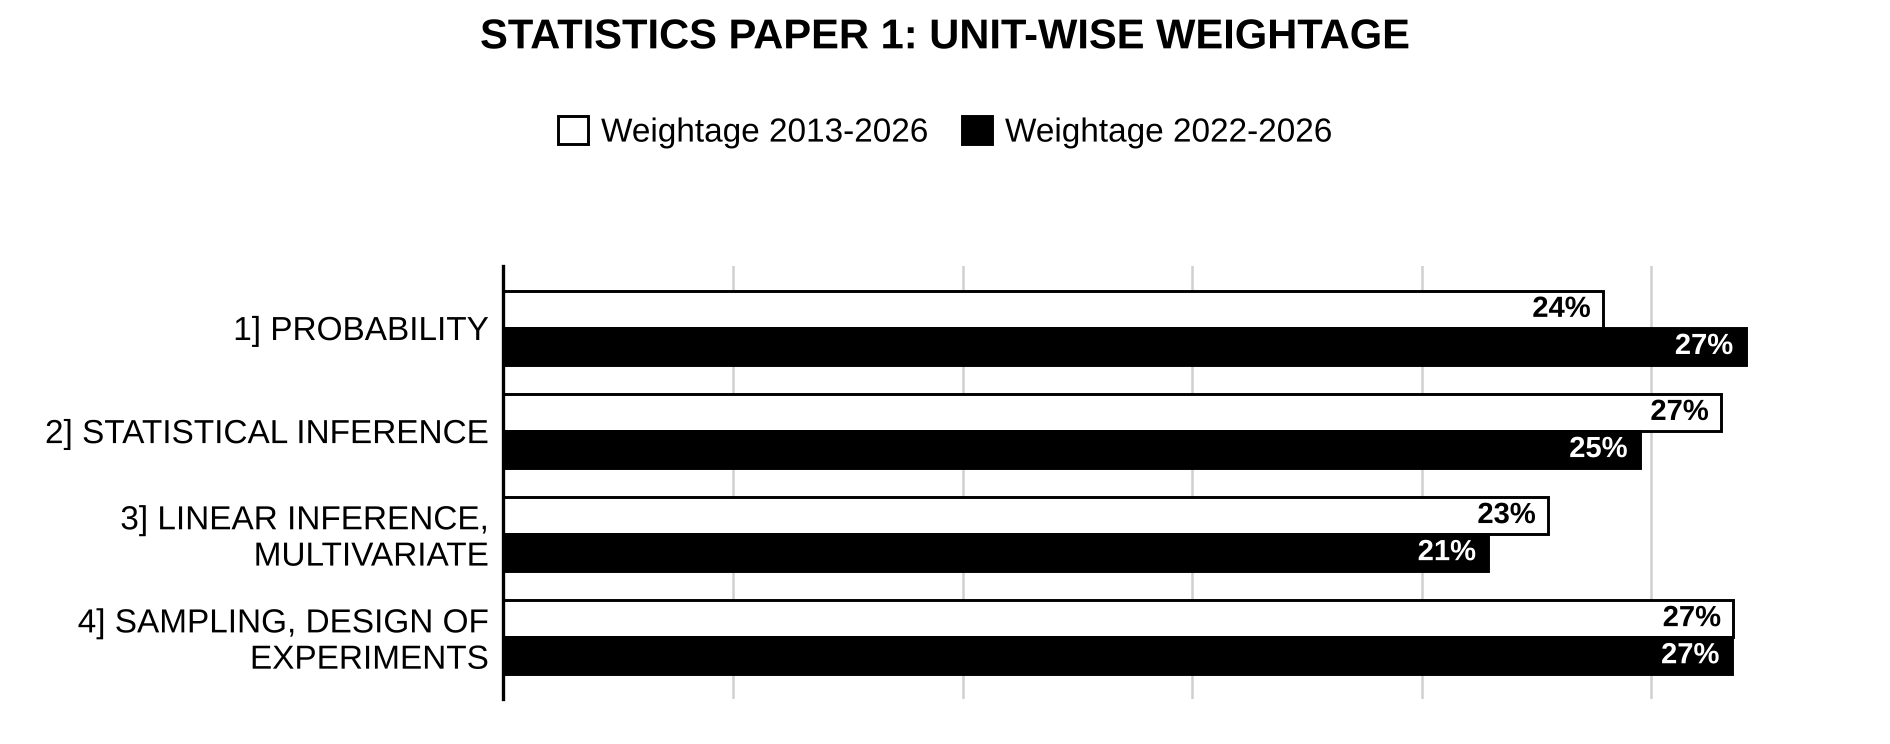
Trend: Paper I is closely balanced across its four units: Sampling Theory and Design of Experiments (about 27%), Statistical Inference (25–27%), Probability (24–27%) and Linear Inference and Multivariate Analysis (21–23%). The most-asked topics since 2013 are probability spaces and random variables (1.1), convergence and the laws of large numbers (1.3), linear models and least squares (3.1), incomplete block designs (4.9), the multivariate normal distribution (3.5), methods of estimation (2.3) and testing of hypotheses (2.5). In 2022–2026 Probability has gained, especially expectation and moments (1.2), and basic designs (4.8) have come up more often, while Hotelling’s T² and Mahalanobis’s D² (3.6), testing of hypotheses (2.5) and incomplete block designs (4.9) have been asked less.

Preparing for Prelims too?
Our UPSC Prelims Topic-wise PYQ eBook covers every Prelims question with detailed explanations, so you can see exactly where UPSC asks from.
View the BookDownload Free SamplePaper II
| Unit | Topic (click to open PYQs) | Sub-topics | Questions | Link |
|---|---|---|---|---|
| 1 | Industrial Statistics | 4 | 239 | Click here → |
| 2 | Optimization Techniques | 9 | 280 | Click here → |
| 3 | Quantitative Economics and Official Statistics | 5 | 265 | Click here → |
| 4 | Demography and Psychometry | 5 | 252 | Click here → |
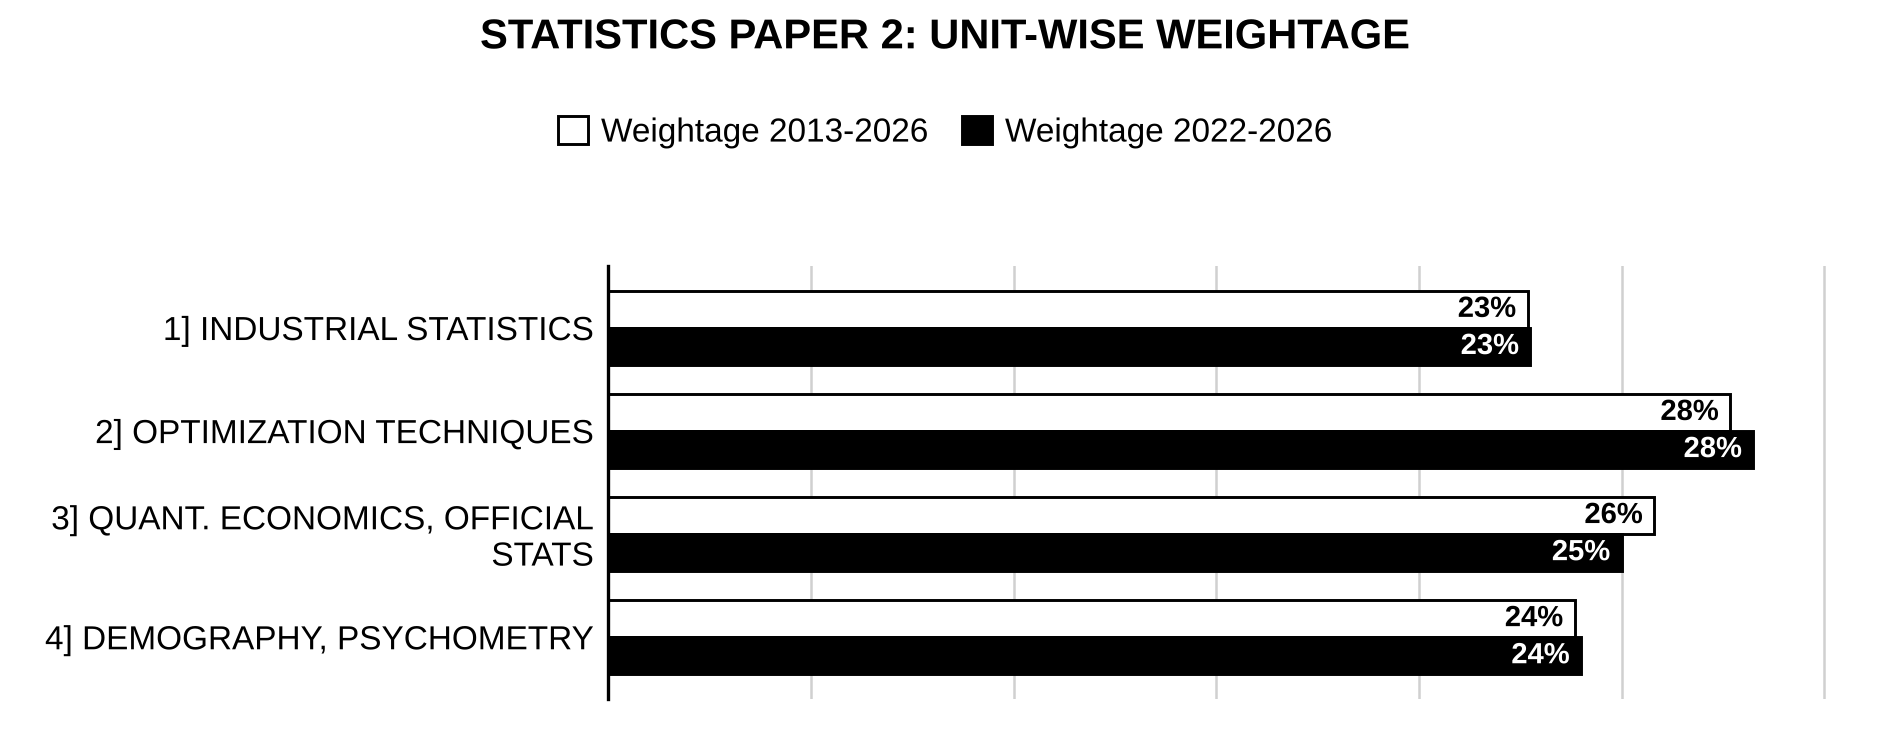
Trend: Paper II is led by Optimization Techniques (about 28%), followed by Quantitative Economics and Official Statistics (25–26%), Demography and Psychometry (about 24%) and Industrial Statistics (about 23%), with little change between 2013–2026 and 2022–2026. The most-asked topics since 2013 are control charts (1.1), psychometry (4.5), linear programming (2.2), time series (3.1), the general linear model and its problems (3.3), acceptance sampling (1.2) and life tables (4.3). In 2022–2026 simultaneous equations (3.4), the general linear model (3.3), life tables (4.3) and queueing (2.8) have come up more often, while time series (3.1), index numbers (3.2) and official statistics in India (3.5) have been asked less.
How this collection is organised
Considering the changing exam pattern over the years, we felt it necessary to declare some practices we’ve adopted in this collection.
Units follow the official syllabus – Paper 1: 1 Probability, 2 Statistical Inference, 3 Linear Inference and Multivariate Analysis, 4 Sampling Theory and Design of Experiments; Paper 2: 1 Industrial Statistics, 2 Optimization Techniques, 3 Quantitative Economics and Official Statistics, 4 Demography and Psychometry. The official syllabus has been divided into numbered topics (e.g. Paper 1 – 4.9 Incomplete block designs) to arrange the questions.
Questions on areas the syllabus does not name separately are placed under the nearest topic: for example, order statistics and transformations of variables under probability spaces and random variables (Paper 1 – 1.1); sampling distributions (chi-square, t, F) under standard distributions (1.6); analysis of covariance under basic designs (4.8); in Paper 2, PERT/CPM under OR models (2.1); and national income estimation under official statistics in India (3.5).
Until 2008 the two papers followed an older syllabus, and some subjects appeared in the other paper (above all sampling and design of experiments, which were in Paper II; also some econometrics and Markov chains in Paper I). The 1995–1999 papers also had more sections and, in Paper II, 20 questions from which candidates chose. Such questions of 1995–2007 are placed under the topic of the present syllabus, even when that topic is now in the other paper; Part III shows each paper as set. From 2009 every question is kept in its own paper.
Some questions cover more than one topic. We’ve kept such questions in each topic of relevance.
Every diagram printed with a question is given as a complete description in square brackets – [Figure: …] – with every numbered pointer and label shown, so that the question can be solved from the description. Standard tables attached to a paper are not reproduced.
Graphs at the start of each paper show the weightage of every unit in that paper, and graphs for each unit show the weightage of its topics. Weightage is the share of marks asked from a unit or topic, compared for 2013–2026 (white bars) and the last five years, 2022–2026 (black bars). A question placed under two topics has its marks split equally between them.
Each of the topicwise question is suffixed by a question code like this [2024/20m/2a]. This code indicates a) year in which the question was asked, b) maximum marks the question carried, c) prescribed word limit (where UPSC set one, e.g. 200w) and, d) the question number in actual paper, in given order.
Until 2012, each paper carried 300 marks (60 per question); since 2013 each paper carries 250 marks (50 per question). Where a compulsory question offered more parts than were to be answered (“any three” of four), every part is included with its own marks. Where a retyped copy of an older paper prints no marks for a part, the code carries the marks implied by the question. Split marks such as 15+5=20 are kept as printed.
The 2026 papers are transcribed from the official UPSC question papers, 2009–2025 from scans of the printed papers, and 1995–2007 from typed copies (a single retyped copy of each, with formulas damaged in retyping restored). Some of these copies print no marks for a whole paper or for some parts; for these the code carries the marks implied by the question pattern. No copy of the 2008 papers could be found.
The wording, figures and data of the questions are as printed, including the papers’ own grammar and apparent misprints such as a wrong symbol or subscript in a formula; these are listed with the likely intended reading in the year-wise notes. Statistical tables attached to a paper are not reproduced.
Spotted an error? Use the “Report an Error” box at the end of any page – we review every report and update the page.

Strengthen your GS papers
Our UPSC Mains Topic-wise & Year-wise PYQ eBook (2013–2026) maps every GS question to the syllabus, so you know what UPSC asks and how often.
View the BookDownload Free SampleLast updated: 31 October 2026