
Here are all 265 Quantitative Economics and Official Statistics questions asked in UPSC Statistics Optional Paper II from 1995 to 2026, arranged under the 5 topics of the official syllabus. Within each topic the latest questions come first.
Each question ends with a code such as [2024/15m/3b] – the year, the marks, the word limit (where UPSC set one) and the question number in the paper.
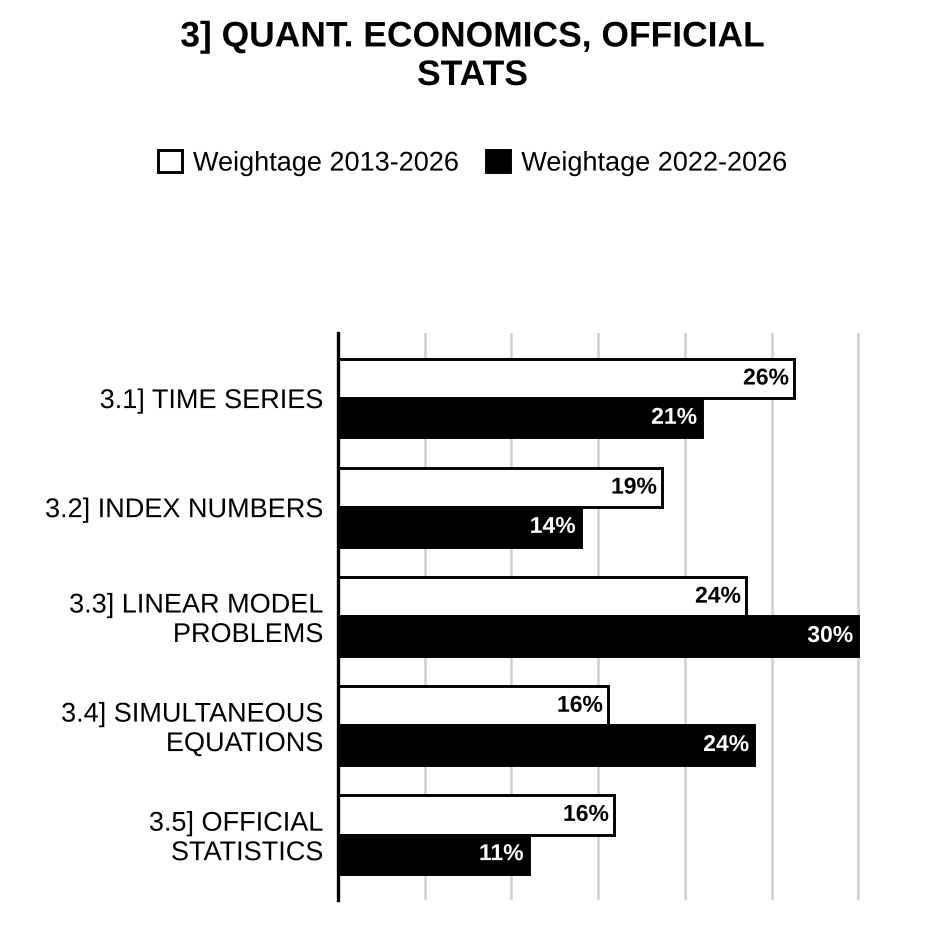
3.1] Time series
66 questions
Define autocorrelation of order and correlogram. For an infinite series generated by the moving average of random components with equal weights, obtain the correlogram of a moving average of extent . [2026/15m/6a]
Define time series. For a moving-average process with weights of random components , where ’s are i.i.d. , obtain the correlogram function. Find its form, when all the weights are equal and their sum is 1. [2025/15m/8a]
Consider AR(1) model with non-zero mean 74·3293 and . If the last observed value is 67, then obtain the forecasting 1 time unit into the future yields. What is the forecasted value of 5 time units into the future? [2024/10m/5b]
In a study of its sales, a motor company in Delhi obtained the following least square equation: where origin is 2000, units (=1 year) and = total number of units sold annually. The company has physical facilities to produce only 4500 units a year and it believes that it is reasonable to assume that at least for the next decade the trend will continue as before. (i) What is the annual average increase in the number of units sold? (ii) By what year will the company’s expected sales have equalled its present physical capacity? (iii) Estimate the number of sales for the year 2020. (iv) What is the slope of the given linear trend equation? (v) How much excess of company’s present physical capacity is in this estimated year 2020? [2023/10m/5b]
Explain the principle of least squares. How it is used in fitting trend in time series analysis? Explain the fitting of trend for the curve . [2023/15m/6a]
Define stationary time series. How would you test the stationarity of the given time series? Write the importance of stationary time series. Check the following time series for stationarity. (i) (ii) (iii) [2023/15m/6b]
Apply the method of link relatives to the following data and calculate the seasonal indices: Price of Rice (in ₹ per 10 kg)
| Quarter | 2001 | 2002 | 2003 | 2004 |
| 1 | 75 | 86 | 90 | 100 |
| 2 | 60 | 65 | 72 | 78 |
| 3 | 54 | 63 | 66 | 72 |
| 4 | 59 | 80 | 82 | 93 |
[2022/10m/5a]
Explain Akaike information criterion for order selection in an ARMA process. [2022/15m/6a]
Explain Box-Jenkins methodology to build ARIMA models. [2021/15m/6a]
Define time series. Distinguish between stationary and non-stationary time series. Give an example of stationary and non-stationary time series. [2020/10m/5b]
Discuss variate difference method with an application. [2020/10m/5c]
Explain in brief how you will determine orders of autoregressive and moving average terms while fitting time series using ARIMA modelling. [2020/15m/6b]
What is Dickey-Fuller (DF) test? Describe how you will use this test for testing stationarity of any given time series. [2020/20m/6c]
Obtain autocorrelation function of autoregressive (AR) process of order two. [2019/10m/5a]
Explain the methods to forecast ARIMA process. [2019/15m/8a]
What is time series? Discuss various components of a time series and their significances in contributing variation in the model. [2018/10m/5c]
Describe the Box-Jenkins methodology to identify a particular time series model. [2018/15m/8a]
Briefly discuss about the Box-Jenkins method of forecasting. [2017/10m/5b]
Define Time series. Give its components and explain each of them. [2017/15m/6a]
The data on quarterly prices in Rupees per kilogram of a commodity during 2005 to 2009 are shown below:
| Quarter \ Year | 2005 | 2006 | 2007 | 2008 | 2009 |
| I | 45 | 48 | 49 | 52 | 60 |
| II | 54 | 56 | 63 | 65 | 70 |
| III | 72 | 63 | 70 | 75 | 84 |
| IV | 60 | 56 | 65 | 72 | 66 |
Compute the seasonal indices by the simple average method and obtain deseasonalised values. [2017/20m/7b]
Why are moving averages calculated in analyzing a time series? State how you would determine the period of the moving average for the following data:
| Year | Value |
| 1 | 130 |
| 2 | 127 |
| 3 | 124 |
| 4 | 135 |
| 5 | 140 |
| 6 | 132 |
| 7 | 129 |
| 8 | 127 |
| 9 | 145 |
| 10 | 158 |
| 11 | 153 |
| 12 | 146 |
| 13 | 145 |
| 14 | 164 |
| 15 | 170 |
[2016/10m/5e]
Explain the nature of cyclical variations in a time series. How do seasonal variations differ from them? Give an outline of link relative method of measuring seasonal variations. [2016/15m/7c]
What are the objectives of analyzing seasonal movement in a time series? How does it differ from the cyclical movement? Describe the method of simple averages to deseasonalize a time series. [2015/10m/5b]
India’s imports (in ’000 crores) for 1980–81 to 1986–87 are given below:
| Year | 1980–81 | 1981–82 | 1982–83 | 1983–84 | 1984–85 | 1985–86 | 1986–87 |
| Imports | 125.5 | 136.1 | 142.9 | 158.3 | 171.3 | 197.7 | 200.8 |
Fit a linear trend by the method of least squares, and plot the observed values and trend values in the same graph paper. [2015/15m/6c]
Let and be independent variables with zero mean and unit variance. Considering , show that the process is stationary with correlogram [2014/10m/5a]
Describe a method of fitting trend by logistic curve. [2014/10m/5d]
Elucidate ARIMA representation of a time series. For an autoregressive scheme show that the correlogram is given by , where is the order of the serial correlation. Also, show that the correlogram is decreasing exponentially for . [2014/15m/7c]
Define Time Series. Write its components and explain them. [2013/10m/5a]
Briefly explain the Schematic representation of the BOX-JENKINS methodology for time series modelling. [2013/20m/7a]
For the AR(1) process defined as , where , and are independent variables, what is the expression for the spectrum (i.e., spectral density)? [2012/12m/5a]
Describe the exponential growth curve. Explain how one checks whether a given time series has exponential growth pattern and how one can fit an exponential trend to a time series. [2012/12m/5d]
Derive the normal equations for fitting a linear trend to time series data. Suppose that a time series has been observed at time points and for this series and . Determine the linear trend equation that will fit the data. [2012/30m/6b]
Explain the concept for moving average model and autoregressive moving average model [ARMA ]. [2011/12m/5d]
Define Time series. Explain briefly different components of Time series. [2010/12m/5b]
Explain the concept of Auto covariance, Auto correlation and their functions. Also explain how the functions are estimated. [2010/12m/5d]
What are the four important stages in ARIMA modelling of a times series data? Explain briefly. [2010/20m/6b]
What do you mean by ‘seasonal index’ in the analysis of a time series? Discuss the different steps involved in the computation of the seasonal indices using link relative method. [2009/12m/5a]
What is a time series? What do you mean by the analysis of a time series? Describe briefly different components of a time series. Which component of the time series is mainly applicable in the following cases? (i) Fall of death rate due to advances in science (ii) Fire in a factory (iii) Sales of new year greeting cards. [2009/15m/7c]
What are the salient features of the Box-Jenkins approach to time series forecasting? [2007/12m/5a]
What are the different methods for determining seasonal variations in a time series? Indicate the seasonal patterns to which these methods are applicable. [2007/20m/6a]
What is a time series? Explain briefly the various components of a time series. Also explain the additive and multiplicative models. [2006/12m/5a]
State the different methods for determining the seasonal variation in a time series. Describe the Link-Relative method. [2006/20m/6a]
Describe the method of link relatives for isolating seasonal variations in a time series. [2005/12m/5a]
What is stationary time series? What are the different schemes or models which may account for oscillatory movements in a stationary time series? [2005/20m/6a]
Describe the method of moving averages for determining the trend component of a time series. How is trend eliminated? [2004/12m/5a]
What are the different methods for determining the cyclical component of a time series? Describe ‘periodogram analyses’. [2004/20m/6a]
Define a second order stationary time series. What does the autocorrelation coefficient of such a series represent? [2003/12m/5a]
What are the components in which a time series is usually decomposed? Explain their roles in understanding the behaviour and predicting future values of a time series. Give one example each where these components are expected to be (i) additive, (ii) multiplicative, justifying these structures in your examples. [2003/20m/6a]
Explain how the trend in a time series is determined by the method of moving averages. [2002/12m/5a]
What are the different methods of determining cyclical component of a time series? For the model , give the periodogram analysis. [2002/20m/6a]
Define a time series and its main components. Explain the terms (i) stationarity and (ii) invertibility in time series. [2001/12m/5a]
Briefly discuss the following in time series analysis: (i) Determination of trend (ii) Forecasting. [2001/20m/6a]
Explain Box-Jenkins methodology in analyzing a time series. [2000/12m/5a]
What is a stationary time series? How do you test the stationary of a given time series? [2000/20m/6a]
What is meant by a time series? Explain the difference between the seasonal and cyclical variations in a time series. [1999/20m/9a]
Explain the use of ARIMA models in forecasting. [1999/20m/9b]
Why is the multiplicative model the most commonly used assumption, as compared to additive model, in time series analysis? Discuss the role of the method of moving averages in time series analysis. [1998/20m/13a]
Explain clearly with the help of an illustration how seasonal index is useful in planning sales or production for specific periods. Are there any limitations of seasonal index? [1998/20m/13b]
Elucidate the role of random components in a time series. Discuss the variate difference method in this connection. [1998/20m/13c]
With a suitable illustration explain the notion of seasonal effects in a time-series. Also explain any one method of measuring the seasonal effects in a time series. Point out the merits and limitations of the method suggested. [1997/20m/13a]
Explain, briefly, a method for studying the random component in a time series, stating the assumptions made,. [1997/20m/13c]
Specify the additive and multiplicative models for a time series. How are seasonal indices constructed? [1996/20m/13a]
Write a note on variate difference method. [1996/20m/13c]
Write a note on short term economic forecasting. [1996/20m/16c]
Discuss any two important procedures to determine the trend component in a time series. [1995/20m/13a]
Write a note on short-term forecasting. [1995/20m/15c]
3.2] Index numbers
54 questions
Explain the uses and limitations of Index Numbers. Calculate Laspeyres’, Paasche’s and Fisher’s Indices for the following data:
| Commodity | Time Period I | Time Period I | Time Period II | Time Period II |
| A | 10 | 2 | 15 | 1 |
| B | 15 | 3 | 10 | 3 |
| C | 20 | 4 | 15 | 4 |
Also, examine whether Paasche’s and Fisher Index Numbers satisfy (i) Time Reversal Test, and (ii) Factor Reversal Test or not. [2026/15m/6b]
Explain the concept of index number. Calculate the Fisher’s ideal index number from the following data and verify that whether it satisfies time reversal and factor reversal tests:
| Commodity | 2006 | 2006 | 2007 | 2007 |
| A | 10 | 40 | 12 | 45 |
| B | 11 | 50 | 11 | 52 |
| C | 14 | 30 | 17 | 30 |
| D | 8 | 28 | 10 | 29 |
| E | 12 | 15 | 13 | 20 |
[2025/15m/7a]
Explain Time Reversal Test, Factor Reversal Test and Circular Test in the Index Number Theory. Using the following data, verify whether the Laspeyres’ formula satisfies Time Reversal Test.
| Commodity | 1979 Price | 1979 Quantity | 1980 Price | 1980 Quantity |
| Rice | 32 | 50 | 30 | 50 |
| Barley | 30 | 35 | 25 | 40 |
| Maize | 16 | 55 | 18 | 50 |
[2024/15m/6b]
State and discuss the important points which have to be considered in the construction of index numbers. [2023/10m/5a]
How does the concept of wholesale price index work? Describe the major components of wholesale price index. Explain the methodology of index numbers of area, production and yield in agriculture. [2022/15m/8a]
.
| Commodities | A | B | C | D | E | F |
| Quantities consumed in 2005 | 6 | 6 | 1 | 6 | 4 | 1 |
| Prices in 2005 | 5.75 | 5.00 | 6.00 | 8.00 | 2.00 | 20.00 |
| Prices in 2006 | 6.00 | 8.00 | 9.00 | 10.00 | 1.50 | 15.00 |
Prepare the cost of living index for 2006 on the basis of 2005 from the above data by (i) aggregative method and (ii) method of weighted relatives and comment. [2021/15m/6b]
What are economic barometers? Show their usefulness as well as their limitations in forecasting economic events. Calculate Fisher’s ideal index from the data given below and show that it satisfies time reversal and factor reversal tests:
| Commodity | 2004 Price | 2004 Quantity | 2005 Price | 2005 Quantity |
| 10 | 19 | 12 | 50 | |
| 12 | 25 | 15 | 20 | |
| 18 | 10 | 20 | 12 | |
| 20 | 5 | 40 | 2 |
[2019/20m/6b]
What are the importances of index numbers? Define the different tests an index number has to satisfy. Which index numbers satisfy these tests? [2018/10m/5d]
Distinguish between wholesale price index number and consumer price index number. How are they calculated? The following data relate to the wholesale prices of six different pulses in June and December of a year:
| Pulses | Weight | Price (in ₹) June | Price (in ₹) December |
| 1 | 1.26 | 120 | 135 |
| 2 | 0.35 | 135 | 156 |
| 3 | 1.79 | 148 | 162 |
| 4 | 1.88 | 132 | 148 |
| 5 | 0.98 | 146 | 158 |
| 6 | 1.12 | 128 | 150 |
Calculate the index number for December with June as the base by weighted aggregative method. [2018/15m/6b]
Given below are the average wage in Rupees per hour of unskilled workers of a factory during the period 2005-2010 and corresponding consumer price index numbers taken 2005 as base year with price index equal to 100. Determine the real wages of the workers during 2005-2010 compared with the wages in 2005.
| Year | 2005 | 2006 | 2007 | 2008 | 2009 | 2010 |
| Average wage per hour (Rs.) | 11.9 | 19.4 | 21.3 | 22.8 | 24.5 | 31.0 |
| Consumer Price Index | 100 | 120.2 | 121.7 | 125.9 | 129.2 | 140 |
Also find the worth of one Rupee in each subsequent year compared to one Rupee in 2005. [2017/15m/7a]
Define Index Numbers. Give its uses and limitations. [2017/15m/8c]
Define the time reversal test for index numbers. Give one example of an index number which satisfies this test and one example which does not. [2016/10m/5c]
(i) State the uses of different index numbers. What tests should a good index number satisfy? In the usual notations, given that , , and . Find the values of Laspeyres and Paasche index numbers and comment on the results. (ii) What are chain base index numbers? If , , then find the value of . [2016/15m/7b]
Explain the difference between Paasche’s and Laspeyres’ index numbers. Check whether they satisfy the time reversal and factor reversal tests. [2015/10m/5a]
The following data relate to the wholesale prices of six different cereals in January and June of a year:
| Cereals | Weight | Price in January (in ₹) | Price in June (in ₹) |
| 1 | 3.68 | 240 | 290 |
| 2 | 2.25 | 174 | 161 |
| 3 | 0.42 | 135 | 165 |
| 4 | 0.18 | 128 | 173 |
| 5 | 0.05 | 133 | 105 |
| 6 | 0.19 | 147 | 180 |
Calculate the index number for June with January as the base by weighted aggregative method. [2015/15m/8c]
Define index numbers. Discuss their uses and limitations. [2014/10m/5c]
Following are two sets of indices one with 1960 as base and the other as 1970 as base:
| Year | 1960 | 1961 | 1966 | 1968 | 1970 | 1971 | 1972 | 1973 |
| Index (Old) | 100 | 110 | 115 | 125 | 150 | … | … | … |
| Index (New) | … | … | … | … | 100 | 105 | 120 | 130 |
Splice the new series to old series, so as to have a continuous series from 1960. Also splice the old series to new series so as to have a continuous series from 1960. [2014/15m/6b]
Explain the time reversal and factor reversal tests of index numbers. Examine whether Laspeyre’s and Paasche’s index numbers satisfy these tests. [2014/15m/8a]
What is cost of living index numbers? Mention the main steps in the construction of cost of living Index. What are its uses? [2013/10m/5c]
Show that Marshall-Edgeworth Index number lies between Laspeyre’s and Paasche’s Index numbers. [2013/10m/8c]
Describe Laspeyres’ and Paasche’s methods for computing price indices. Discuss how Marshall – Edgeworth formula leads to a compromise between the two methods. [2012/12m/5c]
Define Irving Fisher’s “ideal” price index. Explain why it is called an “ideal” index by giving relevant mathematical details. Give an example of well-known price-index formula that is not “ideal” and explain why it is so. [2012/30m/7b]
State Laspeyre’s and Paasche’s index number of prices, and examine whether they satisfy the various tests for index numbers. [2011/12m/5c]
Explain in detail the three tests for fixed base index numbers. [2011/25m/7a]
Specify the time and factor reversal tests for a price index number. Illustrate by a standard price index number which satisfies both the tests. Prove your claim. [2011/25m/8a]
Define Index Number. What does an Index Number mean? Explain the uses of Index Numbers. [2010/12m/5e]
Show that Fisher’s ideal index number and Marsall Edgeworth index number lie between Laspeyre’s and Paasche’s index numbers. [2010/25m/7a]
What is Cost of living Index? Mention the main steps in construction of the cost of living index values. How you will construct it? Explain both the methods. [2010/25m/8a]
What do you understand by cost of living index number? Explain how would you construct it. The following table gives the group index numbers and the weights of different heads of expenditure in the calculation of cost of living index number except the index for the group ‘fuel and lighting’:
| Group | Index | Weight |
| Food | 221 | 35 |
| Clothing | 198 | 14 |
| Fuel and Lighting | – | 15 |
| Rent | 183 | 8 |
| Miscellaneous | 161 | 20 |
If the overall cost of living index is 193, find the index number of fuel and lighting group. [2009/20m/6b]
What are the tests to be satisfied by a good index number? Examine how far they are met using Paasche’s index number and Fisher’s ideal index number. Using Laspeyres’ and Paasche’s index numbers, the price index numbers for the year 1970 with 1966 as base year are 121 and 144 respectively. What would be the value of Fisher’s index number? [2009/20m/7b]
What are the advantages of a chain index over a fixed base index number? [2007/12m/5b]
Describe the essential steps for the construction of an index number of agriculture production. [2007/20m/6b]
What are index numbers? Explain their uses. Discuss the difference between fixed-base and chained-base index numbers. [2006/12m/5b]
Describe the essential steps for the construction of a cost of living index number. [2006/20m/6b]
What are the different tests a good index number should satisfy? How many of them are satisfied by the Fisher’s ideal index number? [2005/12m/5b]
Discuss briefly the various steps for constructing a wholesale price index number. [2005/20m/6b]
Define Fisher’s ideal index number. Why is it called ideal? [2004/12m/5b]
Describe the essential steps for the construction of an index number of industrial production. [2004/20m/6b]
Explain how is the base year of a series of index numbers selected. Why is it necessary to shift the base year from time to time? [2003/12m/5b]
What is an index number? Describe how the index number for wholesale prices and the cost of living index number are constructed. [2002/12m/5b]
Specify the time and factor reversal tests for a price index number. Illustrate by a standard price index number which satisfies both these tests, proving your claim. [2001/20m/6c]
State Laspeyres’ and Paasche’s index numbers for prices and examine whether they satisfy the various tests for index numbers. [2000/12m/5b]
State the Laspeyre’s formula for a price index number and examine whether it satisfies the time and the factor reversal tests. [1999/20m/9c]
Discuss the tests to be satisfied by an ideal index number. Illustrate these with respect to Fishers index number. [1999/20m/10a]
What is a chain-base index number? Discuss its advantages and disadvantages over a fixed-base index number. [1999/20m/10b]
Describe the essential steps for the construction of a cost of living index number. [1999/20m/10c]
State the properties of an ‘ideal’ index number and discuss four important index numbers in respect of them. [1998/21m/14a]
Explain the meaning and uses of cost of living index number. How are weights assigned to various groups and sub-groups? [1998/20m/14b]
Explain what is meant by ‘bias’ in an index number. Give an example of one index number having an ‘upward bias’ and one index number having a ‘downward bias’ [1998/15m/14c]
What are index numbers? State their main uses. Also distinguish between chain base and fixed base index numbers and explain how one can be obtained from the other in the case of a single item. [1997/20m/14a]
Define Marshall-Edgeworth index number and examine whether it satisfies the index number tests. Also show that this index number will lie between the Laspeyre’s and Paasche’s index numbers. [1997/20m/14b]
State the time and factor reversal tests for an index number. Verify whether the price index numbers due to Paasche and Marshall-Edgeworth satisfy these two tests. [1996/20m/13b]
State Laspeyre’s formula for a price index number and examine whether it satisfies time and factor reversal tests. [1995/20m/13b]
Describe a procedure for constructing a cost of living index number. [1995/20m/13c]

Preparing for Prelims too?
Our UPSC Prelims Topic-wise PYQ eBook covers every Prelims question with detailed explanations, so you can see exactly where UPSC asks from.
View the BookDownload Free Sample3.3] General linear model and its problems
65 questions
Discuss methods of detecting the presence of heteroscedasticity. Explain the Goldfeld-Quandt test for detecting it, stating the assumptions required to apply this test. [2026/10m/5b]
For the General Linear Model where obtain the Maximum Likelihood Estimator (MLE) of . Further, let , and is a matrix of order with rank of , . If , where , show that follows chi-square distribution with degrees of freedom (d.f.). [2026/10m/5c]
For the general linear model with and , where is a matrix of fixed numbers with rank , obtain the ordinary least squares estimator of and the dispersion matrix of . Also, prove that is the best linear unbiased estimator (BLUE) of . [2026/20m/7c]
Explain the multicollinearity problem in a regression model. What are its consequences? State the different indicators of multicollinearity and explain. [2025/10m/5a]
Discuss the problem of heteroscedasticity. Given that with , prove that OLS estimates of and possess greater variance than OLS estimates of the transformed version of original model. [2025/10m/5d]
For the linear model , obtain the expressions for Ordinary Least Squares (OLS) and Generalised Least Squares (GLS) estimators of the parameters. Discuss their properties and compare them. [2024/20m/6a]
(i) Discuss the problem of autocorrelation. What are the consequences of OLS estimators in estimating the parameters in the presence of autocorrelation? (ii) Explain the Durbin-Watson test for testing the autocorrelation. [2024/20m/8c]
State the different methods of detecting the presence of heteroscedasticity. Explain in brief the Goldfeld-Quandt Test for detecting the presence of heteroscedasticity. Also write the assumption required to apply this test. For a data on consumption expenditure in relation to income for a cross section of 30 families, after dropping the middle 4 observations, the OLS regression based on the first 13 and the last 13 observations and their associated residual sum of squares are as follows: Regression based on the first 13 observations: (, , df = 11) Regression based on the last 13 observations: (, , df = 11) Check the presence of heteroscedasticity for the above given results and write your conclusion. (, , , ) [2023/20m/6c]
Derive the means and variances of the sampling distributions of the OLS estimates of and in the two-variable linear model . [2022/10m/5b]
Define autocorrelation coefficient. What are its consequences for ordinary least squares? Discuss the maximum likelihood estimation of the model, in the usual notations, with AR (autoregressive)(1) disturbance. [2022/20m/6b]
Explain Zellner’s seemingly unrelated regression model and the feasible generalized least squares method of estimating the model. [2021/10m/5a]
Obtain the generalized least squares estimators in the two-variable model assuming the heteroscedastic variances are known and obtain their variances. [2021/10m/5c]
What is autocorrelation? What are its consequences? Explain the Goldfeld-Quandt test and Glesjer test for heteroscedasticity. [2021/20m/8a]
Explain the concept of multicollinearity in general linear model. How will you detect it? Discuss its impact on OLS estimators and their variances. [2020/15m/8a]
Consider the following models: Model : Model : where and are standardized variables. Show that , where and are the sample standard deviations of the regressor and the regressand respectively. Also find . [2019/10m/5c]
What is the nature of heteroscedasticity? What are its consequences? Explain the formal methods of detecting heteroscedasticity. [2019/15m/6a]
Distinguish between OLS and GLS estimators. Show that OLS estimators are BLUEs. [2018/10m/5a]
Consider a two-variable regression model . Suppose is autocorrelated as , , where is the autocovariance coefficient and is the stochastic disturbance term satisfying OLS assumptions. Obtain an estimate for and its corresponding variance. Also discuss the Durbin-Watson statistic for detecting autocorrelation in the model, and its interpretation. [2018/20m/7c]
What is Multicollinearity? Give its consequences. [2017/10m/5c]
For the k-variate general linear model establish the following relations: (i) (ii) [2016/10m/5d]
Discuss autocorrelation. For the model ; with where and , find the estimate of . Specify Durbin-Watson test. [2016/20m/7a]
What is the meaning of heteroscedasticity? What happens when we use ordinary least square procedure to a model with heteroscedastic disturbance terms? [2016/15m/8b]
Explain the need of weighted least squares estimators over OLS estimators. Describe the models in which this is required. [2015/15m/6b]
What is the problem of multicollinearity? What are its consequences? [2013/10m/6c]
Describe the problem of multi-collinearity in multiple linear regression. How does it affect parameter estimation? Describe some solution for this problem. [2012/12m/5b]
Consider the linear model ’s are independent variables. Obtain the least squares estimates of and for , and , . Obtain also the variance expressions for those least squares estimates. [2012/30m/6a]
Explain Durbin-Watson test for autocorrelation under a general linear model. [2011/20m/6a]
Describe in detail the problem of multicollinearity with an example. [2011/20m/6c]
What is Heteroscedasticity? Write its nature and consequences. Describe the Spearman’s rank correlation test useful for detecting Heteroscedasticity. [2010/20m/6c]
Discuss the problem of autocorrelation and its consequences when one applies least square method for estimating the parameters. [2009/12m/5b]
Define generalized least squares estimator. Obtain mean and sampling variance for the estimator. Show that a generalized least square estimator is equivalent to a two-step procedure estimator. [2009/30m/8b]
What is multicollinearity? Give the methods of overcoming this problem. [2005/12m/5a]
Describe a method for detecting heteroscedasticity in a model. [2005/12m/5e]
Explain the method of generalized least squares for estimating the parameters of a linear model, stating the assumptions underlying it. [2005/20m/6b]
Explain briefly the problem of multicollinearity in general linear models, its consequences and solutions. [2005/20m/6c]
Obtain the generalized least squares technique for estimating the coefficients of a linear model. Compare this with ordinary least squares estimation. [2004/20m/6c]
How does one detect heteroscedasticity in linear – models? What are the implications of heteroscedasticity in estimating the regression coefficients? [2003/20m/6b]
In the standard linear model with , with , show that the maximum likelihood estimates of have the distribution assuming to be an invertible matrix. [2003/20m/6c]
Explain the term autocorrelation. What are the consequences of auto-correlation? Explain how the Durbin-Watson d statistic is used to detect the presence of autocorrelation? [2002/20m/6b]
Discuss the problem of heteroscedasticity in linear models. Describe Glejser test for detecting heteroscedasticity. What are the difficulties in using Glejser test? How do you overcome these difficulties? [2002/20m/6c]
Describe a general linear model (GLM) in K independent variables. Justify the inclusion of a random error term in this model. [2001/12m/5b]
Explain Durbin-Watson test for auto correlation in a GLM. [2001/12m/5c]
Explain the generalized least squares (GLS) method of estimation. Also obtain the GLS estimate of in the model with and if [2000/25m/6b]
Specify the general linear model. Show that under certain conditions (to be stated), the least squares and the maximum likelihood methods produce identical estimators of the coefficients in the model. [1999/20m/11a]
Explain the problem of multicollinearity. Interpret it algebraically and geometrically. Suggest methods to overcome the problem. [1999/20m/11b]
State the problem of autocorrelation and its effect on the least squares estimator, Describe the Durbin-Watson procedure for testing autocorrelation. [1999/20m/11c]
Explain the method of generalized least squares for estimating the parameters of a linear model, stating the assumptions underlying it. [1999/20m/12a]
What do you mean by price elasticity of demand? How will you obtain this measure on the basis of time series data? Discuss the various difficulties that are likely to occur in this connection. [1998/20m/15a]
Show that the least squares estimate of the slope coefficient in the simple linear regression equation is inconsistent when both the variables are subject to errors of measurement. [1998/20m/15b]
Describe how you will test the presence of multicollinearity among the explanatory variables in a linear model. [1998/20m/16a]
Write a note on techniques and models used in demand projections. [1998/20m/16c]
Explain how you will fit the model , where a and b are constants to be estimated and u is a random variable with mean zero, and variance . The data consist of n pairs of observations on . How will you estimate ? [1997/20m/13b]
Explain the term ‘demand elasticity’. What do you understand by family budget data? How will you use this data for estimating the income elasticity of demand of selected items? [1997/20m/14c]
Define autocorrelation and explain how this gets generated in a linear econometric model. Also explain a test for detecting the presence of autocorrelation among the error terms in a model. [1997/20m/15a]
What do you understand by heteroscedastic error term in a model? What are the sources of such disturbances? Explain any one method of estimating the parameters in the presence of such heteroscedastic disturbance terms. [1997/20m/15b]
Formulate a general linear model (GLM), clearly stating the assumptions. Derive the MLE of the parameter vector when the errors in the GLM follow a multivariate normal distribution. [1996/20m/14a]
Explain the procedure for testing the hypothesis (some given constant) in the model . State the underlying assumptions. [1996/20m/14b]
Illustrate a technique which may be used to represent factors like temporal effects and qualitative variables in a GLM. [1996/20m/14c]
Mention the main sources that cause serially correlated disturbances. Outline the Cochrane-Orcutt procedure to estimate the parameters of a linear model when the errors are serially correlated. [1996/20m/15a]
Show that measurement error in the explanatory variables poses a serious estimation problem in the set up of a GLM. Outline an estimation method based on instrumental variables in this context. [1996/20m/15b]
Explain the multi-collinearity problem. Interpret it geometrically and algebraically. Suggest methods to overcome the problem. [1996/20m/15c]
Specify the general linear model. Show that under certain conditions (to be stated) the least squares and the maximum likelihood methods produce identical estimators of the coefficients in the model. [1995/20m/14a]
Explain specification error in a general linear model. What are its consequences? [1995/20m/14b]
State the problem of multi-collinearity in a linear model. Give an example. [1995/20m/14c]
Write a note on estimation of demand functions. [1995/20m/16c]
3.4] Simultaneous equations
34 questions
Explain the 2-stage least squares (2SLS) method of estimation for the following simultaneous equation systems: where = Aggregate consumption expenditure = National income = Non-consumption expenditure = A stochastic variable. [2026/10m/5a]
Consider the following structural equation model assuming Y’s as endogenous and X’s as pre-determined variables: where , , and are stochastic terms. Use rank and order conditions to identify the equations. [2026/20m/8a]
Discuss the problem of identification with an example. State the rank and order conditions of identification. Check the identifiability of the following structural model: [2025/15m/6b]
Describe the 2-stage least squares (2SLS) method of estimation of parameters in linear regression model. Also, state the assumptions and discuss its properties. [2025/20m/8c]
Discuss the concept of structure and model for Simultaneous Linear Statistical Equations (SLSE) model. The application of least squares method for estimating the parameters in SLSE model is inappropriate. Explain. [2024/10m/5c]
Explain the problem of identification with a suitable example. Also discuss the conditions of identification. Check the identifiability of each equation of the following structural model: [2024/15m/7a]
State the order and rank conditions to check the identifiability of the given system of simultaneous equations. Consider the following extended Keynesian model of income determination: Consumption function: Investment function: Taxation function: Income Identity: Where = Consumption expenditure = Income = Investment = Taxes = Government expenditure and ’s = the disturbance terms. In the model the endogenous variables are and and the predetermined variables are and . By applying the order condition, check the identifiability of each of the equations in the system and of the system as a whole. Write your conclusion. [2023/20m/8c]
Consider, in the usual notations, the equation , where is an vector, is an matrix, is an matrix. Derive the equations for the two-stage least square method of estimation. [2022/10m/5c]
Check the identifiability of the following two-equation system: Given the restrictions (i) and (ii) [2021/15m/8b]
What is the problem of identification? Explain it with the help of an example. Establish rank and order conditions of identifiability. [2020/15m/6a]
Consider the two-equation system: Determine the identification status of each equation under restrictions , . Explain the method of estimation of the parameters. [2019/20m/7a]
Given the following demand-and-supply model construct the reduced-form model and justify whether the parameters can be estimated completely. [2018/15m/6a]
What is the problem of identification? Deduce a necessary and sufficient condition for the identifiability of parameters in a structural equation. Examine the identifiability of the following model: [2016/20m/6b]
For estimating simultaneous linear system of equations, how would you use the following methods of estimation and why? (i) Indirect least squares (ILS) method. (ii) Two-stage least squares (2 SLS) method. [2014/20m/7a]
Explain the identification problem, and state the rank and order conditions for identifying a model equation. Show that these conditions are necessary and sufficient. [2011/12m/5a]
Explain in detail two-stage least squares method for estimation. [2011/20m/6b]
What is identification problem? Explain the rank and order conditions of identifiability. [2010/12m/5a]
Discuss the advantages and limitations of two-stage least squares method of estimation. [2007/20m/6c]
Describe the method of two-stage least squares to estimate the parameters of a given equation in a system of simultaneous equation; and show that these estimators are consistent. [2006/20m/6c]
Explain identification problem in a simultaneous equation model. State, without proof, the rank and order conditions of identifiability. Also outline the two-stage least squares method of estimation. [2001/20m/6b]
Explain the identification problem and state the rank and order conditions for indenting a model equation. Are these conditions necessary and sufficient? [2000/15m/6c]
State the problem of identification in simultaneous equations model. Derive a necessary and sufficient condition for the identifiability of an equation. [1999/20m/12b]
Given the two-equation model: where and are endogenous variables and is an exogenous variable, derive the two-stage least square estimate of and prove that it is consistent under certain conditions (to be stated). [1998/20m/15c]
Explain the concept of identification for a simultaneous equation model. Discuss with an example, how the specification of disturbances can lead to identifying relations in a simultaneous equations model. [1998/20m/16b]
Explain the following terms, with examples (i) Predetermined variables (ii) Exogenous variables (iii) Endogenous variables. [1997/20m/15c]
Explain the identification problem in the context of simultaneous equation models. Illustrate with examples. [1997/20m/16a]
State the rank and order conditions for a model to be just identified and justify the same. [1997/20m/16b]
Explain the indirect least squares method of estimating the parameters of an identified equation. Also show that this method is not applicable if the equation is under identified. [1997/20m/16c]
Compare the ILS and 2 SLS methods of estimation in simultaneous equation models. [1996/20m/16a]
Examine for identifiability the two-equation system (i) as it stands, and (ii) if , . [1996/20m/16b]
State the identification problem. Explain why ordinary least squares cannot be used for estimating equations of a simultaneous system. [1995/20m/15a]
Outline the two-stage least squares method, its applicability and properties. [1995/20m/15b]
Substantiate or refute the following statements (i) Identification is logically prior to estimation. (ii) Identification problem refers to the structural equation and not the reduced form. [1995/20m/16a]
Examine for identifiability the system if G is the only exogenous variable (apart from the dummy variable for the constant term) and . [1995/20m/16b]
3.5] Official statistics in India
46 questions
Discuss the agricultural statistics relating to area and yield in our country. Also, point out the need and importance of agricultural statistics. [2025/15m/7c]
Discuss the Indian Statistical System. State some important organisations and explain the main working of the National Statistical Organisation (NSO). [2024/10m/5a]
Explain the method of collection of agriculture data. Describe the (i) official publications for data collection and (ii) statistics collected by the various official agencies pertaining to agriculture production. [2023/15m/8a]
Explain the method of collection of industrial data. Describe the (i) official publications for data collection and (ii) statistics collected by the various official agencies pertaining to industrial production. [2022/15m/6c]
Explain the functions of N.S.S.O. [2021/10m/5b]
Explain price statistics relating to ‘Price Quotations’. Elucidate publications of data concerning foreign trade of India. [2021/20m/6c]
What are the main functions of Central Statistics Office (CSO) and Directorate of Economics and Statistics established in different States? Explain in detail. [2020/20m/8c]
Describe the wholesale price quotations supplied by various agencies and their limitations. [2019/10m/5b]
Explain the methods of collection of area statistics and yield statistics, and their reliability. [2019/20m/8b]
Write a brief note on National Statistical Commission stating the components, functions and objectives of each. [2018/15m/8c]
Briefly discuss about the official statistical system in India. [2017/15m/8b]
Write a note on the present official statistical system in India relating to (i) population, and (ii) agriculture. What are the principal publications relating to such statistics? [2016/15m/6c]
Name any two central statistical organizations in India and explain their functions. [2015/20m/6a]
Write briefly on methods of collecting Agricultural Statistics in India. Also mention its shortcomings. [2013/15m/7c]
What is CSO? Explain and mention its main functions. [2013/15m/8d]
Write a note on official agencies responsible for data collection on trade and prices. [2012/15m/8d]
Write a note on Central Statistical Organization. [2011/20m/8b]
Write briefly on: (i) Methods for collection of official statistics in India (ii) Reliability and limitations of data collection. [2011/15m/8c]
Explain briefly the system of collection of industrial statistics in India. Also mention its reliability and limitations. [2010/20m/8b]
What do you understand by (i) agricultural statistics, (ii) trade and price statistics? What are the present Indian official statistical systems for collecting these data? [2009/20m/6a]
What are the official agencies responsible for the collection of data on (i) population, (ii) agriculture, (iii) trade, and (iv) prices? [2007/12m/5c]
Describe the methods of collection of official statistics on agriculture production and prices. What are their limitations and reliability? [2007/15m/8a]
Explain the functions of CSO as part of the present statistical system in India. [2007/15m/8b]
What are the principal publications relating to data on (i) agricultural statistics, (ii) trades statistics and (iii) Joint-stock companies? [2006/12m/5c]
Describe the present official statistical system in India relating to information about population. [2006/15m/8a]
Describe the official method adopted for collection and publication of economic data and indices in our country. [2006/15m/8b]
What are the principal publications which provide data on (i) agriculture, (ii) industrial production, (iii) trade and (iv) prices? [2005/12m/5c]
What are the methods of collection of official statistics on industrial production and trade? What are their limitations and reliability? [2005/15m/8a]
Explain the functions of NSSO as a part of the present statistical system in India. [2005/15m/8b]
What are the principal publications which provide data on (i) industrial production, (ii) foreign exchange and (iii) mining activity? [2004/12m/5c]
What are the various official agencies responsible for data collection? Discuss their roles. [2004/15m/8a]
Describe the present official statistical system in India dealing with collection of agricultural statistics. [2004/15m/8b]
What is the nodal government agency for the coordination of all statistical data collection in India? What are its major functions and how are they organized? [2003/12m/5c]
What are the principal publications which provide data on: (i) Foreign exchange transactions (ii) Banks and Non-banking financial corporations (iii) Joint stock companies (iv) Mining activity. [2003/12m/5e]
What are the different heads of origin which account for the net domestic product of India? Which agency coordinates the calculation of the net domestic product? [2003/20m/8a]
Explain the role of the Reserve Bank of India in collection and publication of economic/financial data and indices. [2003/20m/8c]
Describe briefly the present official statistical system in India relating to (i) population statistics and (ii) agricultural statistics. [2002/12m/5c]
What are the principal publications that provide data on: (i) agricultural statistics, (ii) industrial statistics and (iii) trade statistics? [2002/15m/8a]
What are the various official agencies responsible for data collection? Discuss their main functions? [2002/15m/8b]
Write briefly on: (i) methods of collection of official statistics in India (ii) their reliability and limitations. [2001/20m/8b]
Write a brief note on Central Statistical Organization. [2001/10m/8d]
What organizations are responsible for collecting population statistics in India? Discuss the types of data collected by them. [2000/12m/5c]
What are the agencies engaged in the collection and publication of price statistics in India? Also discuss the type of statistics published, their reliability and limitations. [2000/20m/8a]
Explain the functions of any two of the organizations engaged in the collection of statistics of industrial production, both under the organized and the unorganized sectors. Where are these statistics published? [2000/10m/8b]
Describe the methods of collection of official statistics in India and name the principal publications containing such statistics. [1999/20m/12c]
National sample surveys. [1996/20m/20a]

Strengthen your GS papers
Our UPSC Mains Topic-wise & Year-wise PYQ eBook (2013–2026) maps every GS question to the syllabus, so you know what UPSC asks and how often.
View the BookDownload Free Sample« Previous: Optimization Techniques | Next: Demography and Psychometry »
Back to: Statistics Optional PYQs – Topic-wise | Also see: Statistics Optional year-wise question papers
Last updated: 31 October 2026