
Here are all 176 Production and Operations Management questions asked in UPSC Management Optional Paper II from 1995 to 2026, arranged under the 15 topics of the official syllabus. Within each topic the latest questions come first.
Each question ends with a code such as [2024/15m/3b] – the year, the marks, the word limit (where UPSC set one) and the question number in the paper.
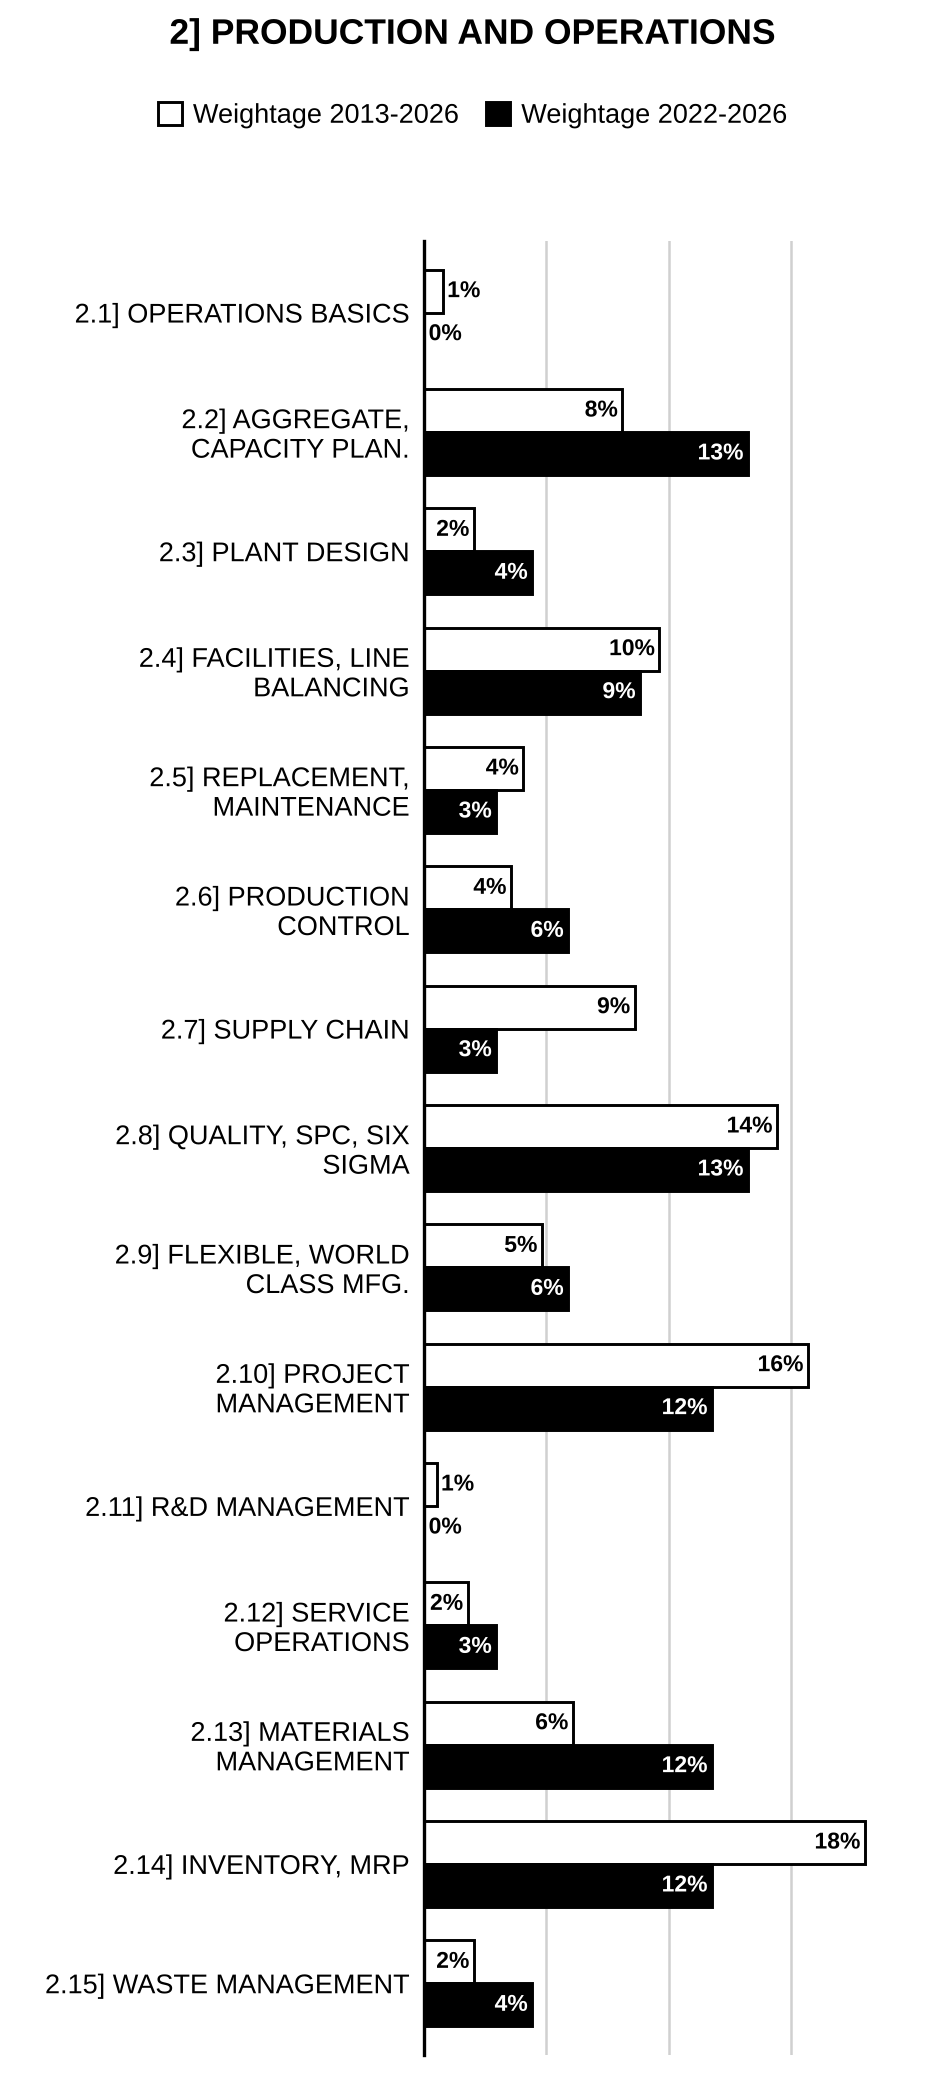
2.1] Fundamentals of operations management
4 questions
(i) What is the difference between Production and Operations Management? Illustrate with the help of examples. (ii) Service operations often face more difficulty in planning than their manufacturing counterparts. However, service does have certain advantages that manufacturing does not have. Explain service planning difficulty and the advantages. Compare by taking one example from a service organisation (e.g. hospital) and another from a manufacturing organisation (e.g. automobile). [2018/15m/2c]
Narrate the historical evolution of Production and Operations Management. Analyse the current challenges facing managers in the light of Economic Liberalisation and Globalisation. [2005/60m/6]
Is it correct to say that nature of products alone determines the type of concerned manufacturing system Support your answer with reasons. [1998/30m/4a]
Examine fundamental of production from management point of view and enumerate various types of manufacturing systems. [1996/30m/4a]
2.2] Aggregate production planning and capacity planning
15 questions
Consider the following aggregate planning problem for four months:
| Regular time | Overtime | Subcontracting | |
| Production capacity/month | 900 units | 300 units | 200 units |
| Production cost/unit | ₹6/- | ₹8/- | ₹9/- |
The forecasted demand for the next four months is 1300, 1400, 1225 and 1475 units respectively. Shortages are not permitted. The initial inventory is 50 units, and the carrying cost is ₹1.60 per unit per month. Provide the aggregate plan for this problem. [2025/15m/3b]
Discuss briefly capacity planning. Explain various kinds of capacity planning. [2024/15m/3a]
List the strategic objectives of aggregate planning. [2022/5m/3a(i)]
Describe the chase and level strategies for aggregate planning. Which one of these should be preferred? [2022/5m/3a(ii)]
How does aggregate planning in service differ from aggregate planning in manufacturing? [2022/5m/3a(iii)]
What is Aggregate Operations Plan? Discuss the different Production Planning Strategies. State the relevant costs associated with Aggregate Production Plan. [2019/15m/2a]
A small firm intends to increase the capacity of a bottleneck operation by adding a new machine. Two alternatives A and B, have been identified and the associated costs and revenues have been estimated. Annual fixed costs would be ₹ 4,00,000 for A and ₹ 3,00,000 for B. Variable costs per unit would be ₹ 100 for A and ₹ 110 for B. Revenue per unit would be ₹ 150. (i) Determine each alternative’s break-even point. (ii) At what volume of output would the two alternatives yield the same profit? [2018/10m/1b]
Product A is assembled from two parts B and C. One unit of A is assembled from 1 unit of B and 2 units of C. Each item requires one or more operations and the lead time everywhere is assumed negligible. Part C requires first machining operation followed by heat treatment. Part B requires only machining operation. Product A requires an assembly operation. The Master Production Schedule (MPS) for product A is given in the table below:
| Month | 1 | 2 | 3 | 4 | 5 | 6 |
| Product A (in units) | 100 | 150 | 100 | 200 | 125 | 100 |
The process time data is shown in the table below:
| Operation | Item | Work center | Standard time/unit (in hr) |
| 10 | C | Machining | 0.5 |
| 20 | C | Heat treatment | 2.0 |
| 30 | B | Machining | 1.0 |
| 40 | A | Assembly | 0.5 |
(i) What will you recommend as normal capacity at each work center? (ii) If the setup cost to produce a batch of product A is ₹ 5,000, the manufacturing cost of the product A is ₹ 2,000 per unit and the inventory holding cost per unit per year is 20% of the product cost, what Master Production Schedule (MPS) will you recommend to minimize sum total of setup and inventory holding costs? (iii) Given the MPS in the table above, what is the schedule of gross requirements of part C? [2013/20m/3a]
How should the factory plan its production? [2012/10m/6a]
What will be the annual production plan that will result in least total annual cost using seven can lines in each month? [2012/30m/6b]
How will the production plan be affected if the factory had an initial inventory of 100 truckloads at the beginning of January? [2012/10m/6c]
How will the production plan be affected if the factory wanted an inventory of 150 truckloads at the end of December, but had no inventory at the start of January? [2012/10m/6d]
Aggregate Production Plan is an intermediate range production plan. Elucidate and briefly explain the Linear Programming Model and the Transportation Problem Approach to aggregate planning. [2003/60m/6]
Explain how demand forecast is the basis of long run production decisions as also of short run production decisions. [1997/30m/4a]
Compare and contrast three different methods of aggregate planning; graphical, linear programming and a heuristic approach. [1995/30m/5a]
2.3] Plant design
9 questions
State the various factors affecting plant location. [2023/15m/3b]
“Plant location is the most important strategic level decision-making.” Explain. List down important factors to be considered for locating a new steel plant. [2020/5m/2a(i)]
In a dynamic and competitive environment, discuss how “Reverse Engineering” and “Concurrent Engineering” approaches help in designing the right type of product/right type of process. [2010/20m/7b]
Discuss the various factors that are taken into considerations while designing a product. [1999/30m/4a]
Plant design rests on some a-priori top management/promoters decisions. Elaborate specifying the decision and their impact on plant design. [1998/30m/5b]
Discuss the merits of process layout vis-a-vis those of product layout and specify the criteria of an ideal layout. [1997/30m/5a]
Describe how you will determine minimum economic size of a plant. Why is it that plant size, in practice, often exceeds the minimum economic size? [1997/30m/5b]
What considerations are important for deciding the location of a plant? Discuss. [1996/30m/5a]
In what ways can the location decision have an impact on the productive system? [1995/30m/4a]
2.4] Management of facilities and line balancing
11 questions
A clock manufacturing company is planning an assembly line to produce 195 clocks per 8-hour shift. The following table gives the work elements, times and immediate predecessors:
| Work Elements | Time (in seconds) | Immediate Predecessors |
| A | 40 | None |
| B | 80 | A |
| C | 30 | D, E, F |
| D | 25 | B |
| E | 20 | B |
| F | 15 | B |
| G | 120 | A |
| H | 145 | G |
| I | 130 | H |
| J | 115 | C, I |
(i) What is the desired cycle time (in seconds)? (ii) What is the theoretical minimum number of stations? (iii) Show your solution on a precedence diagram. (iv) What are the efficiency and balance delay of the solution found? [2026/15m/4a]
What is ‘time and motion study’? [2022/4m/3b(i)]
Define the terms ‘work study’ and ‘method study’. [2022/5m/3b(ii)]
Describe the steps involved in work study and method study. [2022/6m/3b(iii)]
How does the balancing line reduce the cost of idleness? Describe the steps involved in solving a line balancing problem. [2021/5m/4a(i)]
A company is setting up an assembly line to produce 192 units per 8-hour shift. The following table identifies the work elements, times and immediate predecessors:
| Work element | Time (in sec) | Immediate predecessor(s) |
| A | 40 | None |
| B | 80 | A |
| C | 30 | D, E, F |
| D | 25 | B |
| E | 20 | B |
| F | 15 | B |
| G | 120 | A |
| H | 145 | G |
| I | 130 | H |
| J | 115 | C, I |
| Total 720 |
(i) What is the desired cycle time (in seconds)? [2017/5m/3c(i)]
(ii) What is the minimum number of stations? [2017/5m/3c(ii)]
(iii) Draw the precedence diagram. [2017/5m/3c(iii)]
(iv) What are the efficiency and balance delay of the solution found? [2017/5m/3c(iv)]
A toy company is interested in balancing a production line that will manufacture an electronic football game to compete with the similar successful model of its rival. Tasks, task times and precedence requirements are given in the table below:
| Task | Time (in sec) | Predecessors |
| A | 40 | None |
| B | 20 | A |
| C | 15 | B |
| D | 60 | None |
| E | 20 | D |
| F | 10 | C |
| G | 10 | C |
| H | 10 | E |
| I | 10 | E |
| J | 5 | F, G, H, I |
| K | 10 | J |
(i) Construct a sequence diagram. (ii) To balance the line with a 60 second cycle time, what is the theoretical minimum number of work stations required? A 7 hour day is worked. (iii) Balance the line taking 60 second cycle time. (iv) What is the efficiency of the line? [2016/15m/2a]
Consider a production process given below involving processing in four workstations S1, S2, S3, S4. The processing time for processing one unit of product in each of the workstations is given in table below. You can ignore the move time between the workstations. As shown in the figure, 2 units of S2 are available.
[Figure: Process flow – Raw Material → S1; S1 feeds two parallel S2 workstations; both S2 feed S3; S3 → S4 → Finished product]
| Workstation | S1 | S2 | S3 | S4 |
| Processing time (in Min.) | 10 | 16 | 12 | 6 |
(i) How many units are produced in an 8 hour day? (ii) If the processing time in S3 is reduced to 8 minutes, will there be any reduction in work in process? Why? [2015/10m/1b]
XYZ is famous for homemade pizzas which are crisp with thin crust and varied toppings giving the pizzas fabulous tastes. XYZ is revamping its order processing and pizza-making process. In order to deliver fresh pizza fast, six work elements must be completed as shown in the table below:
| Element | Description | Precedence | Time (in min) |
| A | Receive order | – | 2.0 |
| B | Shape dough | A | 1.0 |
| C | Prepare toppings | A | 2.0 |
| D | Assemble pizza | B, C | 3.0 |
| E | Bake pizza | D | 3.0 |
| F | Deliver pizza | E | 3.0 |
(i) Construct a precedence diagram for the process. (ii) If the demand is 120 pizzas per night (5:00 pm to 1:00 am), compute the cycle time for the process. Compute the lead time for the process. (iii) What is the theoretical minimum number of workstations needed to achieve the required production? (iv) How will you balance the production line to produce and deliver 120 pizzas per night? What is the actual minimum number of workstations needed? [2013/15m/3c]
Distinguish carefully between assembly line balancing and machine line balancing. [1996/30m/4b]
What is the goal of the line balancing? What happens if a line is unbalanced? [1995/30m/4b]
2.5] Equipment replacement and maintenance
6 questions
A Tech Solutions is a mid-sized IT consulting company specializing in automated HR and payroll systems for small business. The company has successfully digitized most of its operations, relying heavily on its internal computer systems for payroll processing and report generations. However, despite its automation efforts, the computer system has experienced periodic failures. Over the past 20 months, the computer system has broken down as indicated in the table below:
| Number of Breakdowns | Number of months that Breakdown occurred |
| 0 | 4 |
| 1 | 8 |
| 2 | 6 |
| 3 | 2 |
Each breakdown results in an average loss of ₹4500/- due to time delay and technical service expenses. As a preventive measure, company is considering a monthly service contract for preventive maintenance. If they sign up for the contract, the average number of breakdowns is expected to decrease to 1 per month, and the contract would cost ₹3300/- per month. Based on the given information, advise that the company should go for contract for preventive maintenance or not? [2025/10m/1d]
A firm is considering replacement of an equipment, whose first cost is ₹ 4,000 and the scrap value is negligible at the end of any year. Based on experience, it was found that the maintenance cost is zero during the first year and it is ₹ 1,000 for the second year. It increases by ₹ 300 every year thereafter. (A) When should the equipment be replaced if the interest rate is 0% (zero percent)? (B) When should the equipment be replaced if the interest rate is 12%? [2021/10m/2c(i)]
Explain the advantages and disadvantages of preventive and predictive maintenance. Give one example of suitability of each of these in industry. [2020/5m/2a(ii)]
1000 lightbulbs with a mean life of 120 days are installed in a new company. Their length of life is normally distributed with a standard deviation of 20 days. How many bulbs will expire in less than 90 days? If it is decided to replace all the bulbs together, what interval should be allowed between group replacements if not more than 10% should expire before replacement? [2017/10m/1b]
For a machine, the following data are available:
| 0 | 1 | 2 | 3 | 4 | 5 | 6 | |
| Cost of Spare (₹) | – | 200 | 400 | 700 | 1000 | 1400 | 1600 |
| Salary of Maintenance Staff (₹) | – | 1200 | 1200 | 1400 | 1600 | 2000 | 2600 |
| Loss due to Breakdown (₹) | – | 600 | 800 | 700 | 1000 | 1200 | 1600 |
| Resale Value (₹) | 12000 | 6000 | 3000 | 1500 | 800 | 400 | 400 |
Determine the optimum period for replacement of the above machine. [2016/10m/3b(ii)]
Faced by the problem of frequent breakdowns in equipment and a need of replacement, the top management seeks your advice as to how the problem should be tackled. Incidentally the accessories and parts inventory too has been found to be in shambles. Suggest what the management should do to deal with the situation. [1998/30m/6b]
2.6] Production control
8 questions
The time taken by two machines on various jobs in a factory is tabulated in the table below:
| Job | Processing Time (in hours): Machine–1 | Processing Time (in hours): Machine–2 |
| A | 2.5 | 1.5 |
| B | 3.6 | 2.0 |
| C | 1.1 | 3.25 |
| D | 2.25 | 2.75 |
| E | 3.75 | 1.8 |
| F | 1.25 | 4.0 |
Calculate the loading sequence for the given jobs and machines to make the line balancing properly. [2024/20m/3c]
The M-N Plant manufactures two different products M and N. Selling prices and weekly demands are shown in the following diagram. Each product uses raw materials with costs as shown. The plant has three different machines A, B and C. Each performs different tasks and can work on only one unit of material at a time. Process times for each task are shown in the diagram. Each machine is available 2400 minutes per week. Assume zero setup and transfer times and constant demand. Operating expenses (including labour) total a constant of Rs. 12000 per week. Raw materials are not included weekly operating expenses.
[Figure: Product flow diagram – Resources A, B, C (one each); Availability: 2400 min/wk; Operating Expenses Rs 12000/wk. Product M (Rs 190/unit) is finished on C (15 min/unit), which takes inputs from A (20 min/unit, processing RM1 at Rs 60/unit) and B (15 min/unit, processing RM2 at Rs 40/unit). Product N (Rs 200/unit) is finished on C (15 min/unit), which takes inputs from the same B (15 min/unit, RM2 Rs 40/unit) and a second B operation (15 min/unit, processing RM3 at Rs 40/unit). No weekly demand figures are shown.]
(i) Where is the constraint in this plant? (ii) What product mix produces the highest profit? (iii) What is the maximum weekly profit this plant can earn? [2015/15m/2c]
A job shop incurs different costs per day, for processing 5 different jobs in the shop on a single machine. All jobs are available at time . The data for the jobs is given below:
| Job | Processing time, days | Due date, days |
| 1 | 5 | 13 |
| 2 | 3 | 15 |
| 3 | 7 | 22 |
| 4 | 2 | 9 |
| 5 | 4 | 7 |
Draw Gantt chart for SPT rule, slack time sequence rule, to compute average tardiness and lateness for each of the above rules. [2012/12m/150w/1b]
What do you mean by routing and transportation? [1999/30m/6b]
How does poor production scheduling increase cost of production and chances of increased losses. [1998/30m/4b]
Examine the validity of the statement that tasks relating to control of production are determined by the type of production system. [1997/30m/4b]
What is meant by a schedule evaluation criterion? Discuss. [1996/30m/6a]
What are the main decision areas of job shop scheduling? [1995/30m/5b]
2.7] Supply chain management
16 questions
Define the strategic goals of supply chain management. What is the impact of each element of supply chain management on these goals? Discuss. [2026/10m/150w/1c]
What Supply Chain Management (SCM) strategies were adopted by leading e-commerce companies such as Amazon and Flipkart during the lockdown period caused by the Corona Pandemic? [2021/10m/1b]
What is a Supply Chain? What are the elements of Supply Chain Management? What is the need to manage a supply chain, and what are some potential benefits of doing so? [2019/15m/3c]
What are the differences in respect of supply chain management practices between a brick and mortar firm and an online firm? Illustrate by taking examples from Walmart and Amazon.com encompassing supply chain activities of sourcing, storage, distribution and retailing. [2018/10m/1d]
Case Study XYZ Machine and Electronics Early in 2016, Shekhar Sharma, Director of Supply Management in XYZ Machine and Electronics, met his company’s President at the President’s request, to discuss reducing material costs. The meeting centred on the company’s historical position as a buyer of only domestic products due to constraints in government contracts, that had recently been removed. The company could now consider global sources. The meeting concluded with Sharma receiving authorization to explore the cost-saving potential of global sourcing. XYZ Machine and Electronics XYZ Machine and Electronics is a division of a worldwide conglomerate that specializes in precision machined products and aerospace electronics. While largely government and defence oriented, the company has one commercial aviation electronics division among its 15 autonomous operating groups. Total sales for XYZ during 2015 was approx. ₹ 15,000 crores with over ₹ 5,000 crores being spent by supply management departments of various groups. Supply management function is divided among 15 autonomous divisions. Each has its own supply management department, which reports to division management but adheres to corporate policies and procedures. There is a relatively small corporate supply management staff concerned with corporate policy and common goods and services. The Cost Reduction Objective To maintain its competitive position, XYZ needed to explore all possible ways to reduce costs. In addition to analyzing and working with its domestic suppliers, Shekhar believed it was necessary at this time to begin considering global sources. Global Sourcing Until 2016, XYZ had only purchased globally as part of an offset countertrade requirement. The other exception was the Commercial Aviation Electronics (CAE) division, which had been acquired in 2015 as a means of diversifying XYZ’s electronics markets. CAE not only had been buying from foreign sources but also had established a factory in Singapore to source and manufacture one of its product lines. CAE’s offshore experience began before being acquired by XYZ. At first, parts were purchased from Singapore and other East Asian sources. These parts were then assembled in this country. Soon CAE began to buy assemblies in East Asia and finally all factory operations were shifted to their own Singapore facility. When Shekhar contacted each of the other’s supply managers, he was surprised to discover that each one had a collection of horror stories of past attempts to establish global sources of supply and was unwilling to try again. Most of these stories centred around problems of communication, quality control, credibility and understanding. Shekhar again contacted the CAE supply manager to discuss details of the Singapore operation. Not only did the Singapore factory build a product line, but also the Singapore supply department sourced components for that product line from throughout East Asia. Initial cost savings from first buys including engineering, test fixtures and other start-up costs ranged from 10% to 18%. Subsequent purchases yielded savings in the 25% to 40% range compared to domestic sources. Quality and delivery problems were minimal. Following that conversation, Shekhar wondered what he might do next. (i) What are the problems being faced by the organisation? (ii) What choices for starting a global sourcing programme exist? (iii) Would XYZ benefit from an international supply management office in Asia? [2018/20m/3a]
Discuss the supply chain efficiency of ‘Amazon.com’ with special reference to international supply chain design. [2017/15m/2b]
An FMCG company G & P Ltd. is in the business of making and selling diapers through its supply chain. It is facing a serious problem of huge inventory in one period followed by a large number of stock-outs in the next period. The pattern is getting repeated again and again. On analyzing the problem, the company found that as demand information moves upstream in the supply chain, the demand variability is getting amplified. A supply chain consultant was approached by G & P Ltd. who suggested that this problem is due to Bullwhip Effect. (i) What are the possible reasons of Bullwhip Effect? (ii) How can Bullwhip Effect be contained? (iii) What is the role of Point of Sales (PoS) information on the Bullwhip Effect? [2014/10m/1a]
What are the two main factors which you would use for vendor evaluation and selection for providing security services at office premises? [2014/5m/1d(ii)]
Identify the internal and external parts of the supply chain enhanced by the system. [2011/10m/2i]
Explain how purchasing was improved. What functions does MRP perform? How is this improved by automation? [2011/20m/2ii]
How are Quant’s customers better served now? [2011/10m/2iii]
What additional steps can Quant take? [2011/10m/2v]
Discuss in detail the different supply chain strategies. What is an appropriate supply chain design for a competitive environment? [2009/60m/4]
Vendor Evaluation and Audit. [2005/20m/200w/5a]
Supply Chain Management. [2004/20m/200w/5a]
What is D G S & D? Write a note on purchase process and procedure adopted by this directorate. [1996/30m/6b]

Preparing for Prelims too?
Our UPSC Prelims Topic-wise PYQ eBook covers every Prelims question with detailed explanations, so you can see exactly where UPSC asks from.
View the BookDownload Free Sample2.8] Quality management
26 questions
A manufacturing facility specializing in Sheet Metal Production has implemented a Statistical Quality Control Program to monitor and improve process performance. As a part of this initiative, an Engineer has recorded the number of visible surface defects identified on 20 sequential metal sheets, each representing one production unit. The data collected during this inspection phase are given below:
| Sheet No. | 1 | 2 | 3 | 4 | 5 | 6 | 7 | 8 | 9 | 10 | 11 | 12 | 13 | 14 | 15 | 16 | 17 | 18 | 19 | 20 |
| Defect Counts | 5 | 6 | 4 | 4 | 6 | 7 | 0 | 6 | 5 | 3 | 1 | 4 | 5 | 3 | 6 | 4 | 3 | 1 | 3 | 4 |
Using the above information: (i) Determine the Center line (CL), Upper control limit (UCL) and Lower control limit (LCL). (ii) Plot the appropriate Control Chart and interpret the result. [2025/10m/1c]
Discuss in brief various phases of quality management. [2024/15m/3b]
Mention the characteristics of control charts. [2022/4m/3c(i)]
What is P-chart? [2022/4m/3c(ii)]
The following are the inspection results of 10 lots, each lot having 300 pieces. The number of defective pieces in each lot is 25, 30, 35, 40, 45, 35, 40, 30, 20 and 50:
| Date (in Novem.ber) | No. of pieces inspected (a) | No. of defective pieces found (b) |
| 4 | 300 | 25 |
| 5 | 300 | 30 |
| 6 | 300 | 35 |
| 7 | 300 | 40 |
| 8 | 300 | 45 |
| 10 | 300 | 35 |
| 11 | 300 | 40 |
| 12 | 300 | 30 |
| 13 | 300 | 20 |
| 14 | 300 | 50 |
| Total number = 10 | 3000 | 350 |
Calculate the average fraction defective and three sigma limits for P-chart, and state whether the process is in control. [2022/12m/3c(iii)]
A manufacturing company always uses a sample size of 10. Data for the past 10 samples are as follows:
| Number of Defective Units | Total Units Sampled |
| 150 | 1,000 |
The system is believed to be operating under normal conditions. (A) Construct a control chart with control limits such that measurements for 95% of the units under normal conditions would fall within the control limits. (B) Suppose the number of units defective in the next 5 samples are: 3, 4, 2, 0 and 7. Demonstrate graphically whether the process is under control or not. [2021/10m/3c(ii)]
W.E. Deming said, “85% of poor quality can be attributed to management”. Discuss this statement in the context of World Class Manufacturing Systems. [2021/5m/4a(ii)]
What role is played by Green belts, Black belts and Master Black belts for managing ‘Six-Sigma’ quality in a Software Development Company? [2021/5m/4a(iii)]
List down Variable and Attribute control charts used to monitor quality of a product. Explain the use of “” and “p” charts. [2020/5m/3b(i)]
Business writer Tom Peters has suggested that in making process changes, we should “Try it, test it, and get on with it.” How does this square with the Define, Measure, Analyse, Improve and Control (DMAIC)/continuous improvement philosophy? [2019/10m/1b]
(i) Why do items managed or procured by an organisation need to be classified? How does ABC analysis help the organisation in this regard? (ii) What trade-offs are involved while determining economic order quantity for an organisation? (iii) As part of an insurance company’s training program, participants learn how to conduct an analysis of clients’ insurability. The goal is to have participants achieve a time in the range of 30 to 45 minutes. Test results for three participants were: Shyam, a mean of 38 minutes and a standard deviation of 3 minutes; Mohan, a mean of 37 minutes and a standard deviation of 2.5 minutes and Kaushik, a mean of 37.5 minutes and a standard deviation of 1.8 minutes. Which of the participants would you judge to be capable? Explain. [2018/20m/4c]
Explain DMAIC methodology in the context of Six Sigma Quality. [2017/5m/1c(ii)]
What is meant by cost of quality? Describe its components. [2016/5m/1d(iii)]
What is statistical process control? How is it different from acceptance sampling? When is a process said to be out of control? How can control-charts be of use in identifying out of control process? Explain. [2016/5m/4a(i)]
Arora Electronics Company (AEC) is receiving a lot of customers’ complaints and returns of DVD players that it manufactured. When a DVD is pushed into the loading mechanism, it can stick inside and it is difficult to get the DVD out. Consumers will try to pull the DVD drawer out with their finger or pry it out with an object like knife, pencil or screwdriver, frequently damaging the DVD or hurting themselves. AEC is keen to improve this quality problem. (i) What are the different dimensions of quality? How can quality be measured by AEC? (ii) Explain the three main classifications of quality costs. Are these related with one another? (iii) Suggest the seven basic quality tools that are used in total quality management. How can these be used by AEC? (iv) Crosby, a leading quality Guru, said, “Quality is free.” AEC management fails to understand this because for better quality management they need money. How will you explain to them the rationale of what Crosby said? [2014/20m/2a]
(i) Describe briefly each step of the six-sigma methodology popularly known as DMAIC methodology. (ii) In statistical quality control, what is the difference between ‘control by variables’ and ‘control by attributes’? What are the most popularly used control charts used for ‘control by variables’ and ‘control by attributes’? (iii) In Just In Time (JIT) manufacturing system, how does the ‘subsequent process’ signal the ‘preceding process’ to produce the quantity required? [2013/10m/1d]
A furniture company manufactures four-drawer filing cabinets in six stages. In the first stage, the boards forming the walls of the cabinet are cut; in the second stage, the front door panels are woodworked; in the third stage, the boards are sanded and finished; in the fourth stage, the boards are cleaned, stained and painted with a clear finish; in the fifth stage, the hardware for pulls, runners and fittings is installed; and in the final stage, the cabinets are assembled. Inspection occurs at each stage of the process, and the average percentages of good quality units are as follows:
| Stage | 1 | 2 | 3 | 4 | 5 | 6 |
| Average percentage of good quality (%) | 87 | 91 | 94 | 93 | 93 | 96 |
The cabinets are produced in weekly production runs with a product input of 300 units. The company later investigated the manufacturing process to identify potential improvements that would improve quality. The company identified two alternatives each costing ₹ 9,00,000 as follows:
| Alternative | Quality improvement | Quality improvement |
| 1 | Stage 2: 96% | Stage 4: 97% |
| 2 | Stage 5: 97% | Stage 6: 98% |
(i) Determine the weekly product yield of good quality cabinets without process improvement. (ii) Which alternative will yield greatest increase in product of good quality and why? (iii) Which alternative will be most cost-effective and why? [2013/15m/2a]
What is meant by “Statistical Process Control”? What are range and mean charts? The range and mean charts were used to determine the mean and standard deviation of a process making a cylindrical component. The mean value of the outer diameter was found to be 7.724994 centimetres and the standard deviation of the outer diameter was 0.000433 centimetres. The specification for the outer diameter was centimetres. Does the process have desired capability to produce the component as per the specifications? [2012/12m/150w/5b]
Six Sigma Quality Management. [2010/10m/1d]
Quality Management. [2007/20m/200w/5a]
Techniques of Total Quality Management. [2005/20m/200w/5c]
‘Quality Circle’ for quality management. [2003/20m/200w/5a]
Explain the advantages and disadvantages of standardization giving the role of ISO certification. [1999/30m/4b]
Discuss the methodology of constructing a control chart and its usage. [1999/30m/5a]
Explain the chief techniques of Statistical Quality Control. [1999/30m/5b]
Why and how is the quality of a manufactured product controlled? What are the difficulties which may have to be faced? Suggest a suitable organisation and procedures for an effective and economical set up for quality control. [1998/30m/6a]
2.9] Flexible and world class manufacturing
11 questions
Discuss in brief flexible manufacturing systems. [2024/10m/1e]
State the attributes of world class manufacturing which are aimed to fulfil the customer demands. [2023/10m/1c]
W.E. Deming said, “85% of poor quality can be attributed to management”. Discuss this statement in the context of World Class Manufacturing Systems. [2021/5m/4a(ii)]
What is Kanban Production Control System? State the different possible approaches for Kanban System. Determine the number of Kanbans needed for setting up a Kanban Control System. [2019/10m/1d]
“JIT is not for India. We have poor supplier reliability, country is so vast that to get some parts here in Gurgaon, I have to source it all the way from Thane down south. How can I achieve JIT in such a context? Impossible! And … then we have a pathetic logistics system. Truck owners take you for ransom once your load is with them. I expect an item in 6 days and get it in 16 days and you suggest JIT to me … I tried it once and my clients got their orders at least a month late.” These were some words spoken to you, a JIT (Just in Time) consultant by a machine tool manufacturer located in North India. Do you think, JIT is feasible in his plant? The machine tools are generally made to order and order fulfillment time is around 2-3 weeks. The assembly takes a maximum of 3 days. There are around 20 major parts for the product. What are the aspects you have to concentrate on to ensure JIT success? What structural modifications do you suggest in this case? State your assumptions clearly and prepare a proposal indicating the methodology you would adopt to implement JIT (if you decide in favour) or a proposal why JIT cannot be implemented (if you decide against it). [2015/10m/1d]
(i) Describe briefly each step of the six-sigma methodology popularly known as DMAIC methodology. (ii) In statistical quality control, what is the difference between ‘control by variables’ and ‘control by attributes’? What are the most popularly used control charts used for ‘control by variables’ and ‘control by attributes’? (iii) In Just In Time (JIT) manufacturing system, how does the ‘subsequent process’ signal the ‘preceding process’ to produce the quantity required? [2013/10m/1d]
In the general context of vendors, distinguish between MRP and JIT, with illustrations. [2012/13m/200w/2e]
Flexible Manufacturing System. [2010/10m/1c]
Just-in-Time Approach. [2007/20m/200w/5b]
What do you understand by management control system? Discuss Computer integrated manufacturing and Computer aided design methods and bring out their implications for management control. [2006/60m/7]
Discuss any two of the Management control methods like JIT (Just in Time), TQM (Total Quality Management), CIM (Computer Integrated Manufacturing) and CAD (Computer Aided Design), and their implications for Management control. [2002/60m/8]
2.10] Project management concepts
13 questions
The following table shows, for each activity of a big project, the normal and crash times as also the normal and crash costs. The contract includes a penalty clause of ₹200 per day in excess of 20 days. The overhead cost is ₹400 per day:
| Activity | Time (in day): Normal | Time (in day): Crash | Cost (in ₹): Normal | Cost (in ₹): Crash |
| 1–2 | 6 | 4 | 600 | 1,000 |
| 1–3 | 4 | 2 | 600 | 1,400 |
| 2–4 | 5 | 3 | 500 | 1,500 |
| 2–5 | 3 | 1 | 450 | 650 |
| 3–4 | 8 | 6 | 1,000 | 2,200 |
| 4–6 | 10 | 6 | 800 | 3,000 |
| 5–6 | 4 | 2 | 400 | 1,000 |
| 6–7 | 4 | 3 | 450 | 800 |
(i) Draw a project network and determine critical path. (ii) Find the cost of completing the project in normal time. (iii) Crash the project activities and determine the cost of completing the project in minimum time. (iv) What is the optimal duration of the project and what is the cost involved? [2026/20m/4c]
The warehouse owner of Quick Industries is considering a new computer system for accounting and inventory control. A computer vendor sent the following information about the system installation:
| Activity Identification | Activity description | Immediate Predecessor | Time (Days): Most optimistic | Time (Days): Most likely | Time (Days): Most pessimistic |
| A | Selection of Computer Model | – | 5 | 7 | 9 |
| B | Input/output System Design | A | 6 | 8 | 16 |
| C | Monitoring System Design | A | 5 | 9 | 13 |
| D | Computer Hardware Assembly | B | 16 | 21 | 26 |
| E | Development of main Programs | B | 11 | 19 | 27 |
| F | Input/output routines development | C | 9 | 10 | 17 |
| G | Database Creation | E | 5 | 9 | 13 |
| H | Installation of the system | D, F | 2 | 3 | 4 |
| I | Testing and Implementation | G, H | 7 | 8 | 9 |
(i) Draw the network diagram for this information. Identify the Critical Path and expected project completion time. (ii) Calculate the probability that the project will be completed in 61 days. (iii) When the company wants to be 95% sure that the system will be installed by a certain date, how many days prior to that should it start the work? [2025/20m/3c]
For a project, the following information is given:
| Activity | Node | Expected Activity Completion Time |
| A | 1 – 2 | 11 |
| B | 2 – 3 | 10 |
| C | 2 – 4 | 8 |
| D | 2 – 5 | 5 |
| E | 3 – 6 | 6 |
| F | 4 – 6 | 9 |
| G | 5 – 7 | 2 |
| H | 6 – 7 | 7 |
| I | 7 – 8 | 12 |
| J | 7 – 9 | 5 |
(A) Draw the network diagram. (B) Find the critical path. [2021/5m/4a(iv)]
A building project has the following time schedule:
| Activity | Time (in months) | Activity | Time (in months) |
| 1 – 2 | 2 | 3 – 7 | 5 |
| 1 – 3 | 2 | 4 – 6 | 3 |
| 1 – 4 | 1 | 5 – 8 | 1 |
| 2 – 5 | 4 | 6 – 9 | 5 |
| 3 – 6 | 8 | 7 – 8 | 4 |
| 8 – 9 | 3 |
Draw a suitable network and calculate:
(i) Critical path and its duration [2020/4m/1e(i)]
(ii) Total float for each activity [2020/4m/1e(ii)]
(iii) If the duration of activity 7 – 8 is increased to 6 months, will the critical path change? If yes, what is the new critical path? [2020/2m/1e(iii)]
A project manager gathered important information for a new project which is given below:
| Activity | Time estimates (in weeks): Optimistic | Time estimates (in weeks): Most likely | Time estimates (in weeks): Pessimistic | Immediate predecessor(s) |
| A | 1 | 4 | 7 | — |
| B | 2 | 6 | 7 | — |
| C | 3 | 3 | 6 | B |
| D | 6 | 13 | 14 | A |
| E | 3 | 6 | 12 | A, C |
| F | 6 | 8 | 16 | B |
| G | 1 | 5 | 6 | E, F |
(i) Draw the network diagram by Arrow-On-Node (AON) method. Calculate the expected time and variance for each activity. [2017/5m/4b(i)]
(ii) Calculate the activity slacks and determine the critical path using the expected activity times. [2017/10m/4b(ii)]
(iii) What is the probability of completing the project within 23 weeks? [2017/5m/4b(iii)]
Ranbaxy Ltd. is deciding to invest ₹ 10 crore in research for development of medicines to cure HIV/AIDS. Can you term it as a “project”? Justify. [2016/5m/2c(iii)]
The Director of continuing education at SUV University has just approved the planning of a sales seminar. His administrative assistant has identified various activities and their relationships to each other. In view of the uncertainty involved in planning the seminar, the assistant has provided three time estimates (in days) for each activity, namely: pessimistic time (b), optimistic time (a) and most likely time (m). Three activities–1. Design brochure and course announcement (5, 7, 8); 2. Identify prospective teachers (6, 8, 12); 3. Prepare detailed outline (3, 4, 5) can start without any other activity being completed. Activity 4. Send brochure and student applications (11, 17, 25) can start after activity 1 has been completed. Activity 5. Send teacher applications (8, 10, 12) depends on the completion of activity 2. Activity 6. Select teacher for the seminar (3, 4, 5) can start after activities 3 and 5 are complete. Activity 7. Accept students (4, 8, 9) depends on the completion of Activity 4. Activity 8. Select text (5, 7, 9) depends on completion of Activity 6. Activity 9. Order and receive texts (8, 11, 17) can start after activities 7 and 8 have been completed. Activity 10. Prepare room for the class (4, 4, 4) can start after Activity 7 is completed. (Figures in brackets give the values of a, m, b in days for each respective activity) (i) Draw the network diagram for the project. (ii) What is the expected duration and standard deviation of the duration of the project? (iii) The Director wants to conduct the seminar in 47 working days. What is the probability of doing this? [2015/20m/4b]
Consider the (simplified) list of activities and predecessors that are involved in building a small house as given below, along with their duration (in days):
| Activity | Description of Activity | Predecessor Activity | Duration (in days) |
| A | Build foundation | – | 5 |
| B | Build walls and ceilings | A | 8 |
| C | Build roof | B | 10 |
| D | Do electrical wiring | B | 5 |
| E | Fix doors and windows | B | 10 |
| F | Painting | C, E | 3 |
We assume that the builder works everyday once work is started on building the house. Each day of work implies working from morning 9 AM to evening 6 PM. (i) If the foundation work is started on morning 9 AM of 1st November, when can the builder complete all the activities involved in building the house? (ii) If the electrical wiring work takes 10 days, when can the builder complete all the activities involved in building the house? (iii) If the painting work takes 5 days, when can the builder complete all the activities involved in building the house? [2014/20m/4a]
Project management in India, in particular of projects in infrastructure sector, has been characterized by severe time and cost overruns. What are the major factors accounting for these overruns? Currently, what are the estimates of these overruns? [2013/10m/6c]
A textile mill was inspected by government safety inspection team and found to be in violation of a number of safety regulations. The inspectors ordered the mill to alter some existing machinery to make it safer (i.e., add safety guards, etc.); purchase some new machinery to replace older, dangerous machinery; and relocate some machinery to make safer passages and unobstructed entrances and exits. The mill was given only 35 weeks to make the changes. If the changes were not made by then, the mill would be fined ₹ 2 crores. The mill determined the activities to be completed, prepared three time estimates for each activity namely: pessimistic time, optimistic time and most likely time. Table below gives the data compiled by the mill:
| Activity | Description | Activity (immediate predecessor) | Time estimates (in weeks): a | m | b |
| 1 | Order new machinery | – | 1 | 2 | 3 |
| 2 | Plan new physical layout | – | 2 | 5 | 8 |
| 3 | Determine safety changes | – | 1 | 3 | 5 |
| 4 | Receive equipment | 1 | 4 | 10 | 25 |
| 5 | Hire new employees | 1 | 3 | 7 | 12 |
| 6 | Make plant alterations | 2 | 10 | 15 | 25 |
| 7 | Make changes in existing machinery | 3 | 5 | 9 | 14 |
| 8 | Train new employees | 4, 5 | 2 | 3 | 7 |
| 9 | Install new machinery | 4, 5, 6 | 1 | 4 | 6 |
| 10 | Relocate old machinery | 4, 5, 6, 7 | 2 | 5 | 10 |
| 11 | Conduct employee safety orientation | 8, 9, 10 | 2 | 2 | 2 |
(i) Determine the expected duration of the project. (ii) Identify the critical activities in the project. (iii) What is the probability that the mill will be fined ₹ 2 crores? [2013/25m/8a]
How does the PERT technique help a business manager in decision making? What is critical path analysis? Describe with illustration its utility in project planning and control. [2002/60m/4]
Discuss the role of PERT and CPM as project planning and scheduling techniques. [2001/60m/4]
Differentiate between PERT and CPM giving their limitations. [1999/30m/6a]
2.11] R&D management
1 question
Apply the concept of “Decay Curve of New Product Ideas” to an innovative product like ‘e-Bike’. [2021/5m/3c(i)]
2.12] Management of service operations
2 questions
“The difference between management of manufacturing (goods) and service operations is reducing.” Discuss this statement in the light of the fundamental differences existing between goods and service operations. [2022/10m/1c]
(i) What is the difference between Production and Operations Management? Illustrate with the help of examples. (ii) Service operations often face more difficulty in planning than their manufacturing counterparts. However, service does have certain advantages that manufacturing does not have. Explain service planning difficulty and the advantages. Compare by taking one example from a service organisation (e.g. hospital) and another from a manufacturing organisation (e.g. automobile). [2018/15m/2c]
2.13] Materials management
18 questions
Discuss the importance of value analysis in a manufacturing company. Explain the steps involved in this process. [2026/10m/150w/1d]
State the symptoms when the value analysis is to be initiated in a company. [2023/10m/1e]
An automobile company has additional capacity that can be used to manufacture brakes that the company is presently buying for ₹ 500 each. If the company makes the brakes, it will incur materials cost of ₹ 100 per unit, labour cost of ₹ 130 per unit and variable overhead cost of ₹ 30 per unit. The annual fixed cost associated with the unused capacity is ₹ 2,50,000. Demand over the next year is estimated to be 5000 units of brakes. (i) Would it be profitable for the company to manufacture the brakes? (ii) Suppose the capacity could be used by another department for production of some agricultural equipment that would cover its fixed and variable cost and contribute ₹ 1,00,000 to profit. Which would be more advantageous, brakes production or agricultural equipment production? [2023/20m/3c]
Define scrap, surplus and obsolete items, giving one example of each. How can you maximise return from these in a manufacturing unit? [2020/5m/2a(iii)]
“Value Engineering and Value Analysis play very important roles in cost minimisation.” Elaborate. [2020/5m/2a(iv)]
How would you apply the principles of value analysis to reduce cost overruns in Indian projects? [2014/5m/1b(i)]
What are the phases that you will follow in the process of value analysis? [2014/5m/1b(ii)]
At present the company is making the product in house. The company wishes to evaluate the option of outsourcing the product. How should the company systematically carry out the make or buy analysis? [2011/10m/4iii]
Spending money on materials management is waste because it adds to costs only and does not improve the quality and efficiency of production. Discuss. Give the methods of material handling and build up argument for the best mechanism of material handling. [2007/60m/6]
Value Analysis. [2006/20m/200w/5d]
Materials handling does not add anything to the value of the product. It only increases the cost of the product. Critically analyse the statement. [2004/60m/6]
Result accelerators are a group of techniques that are basically used in Value Analysis to identify unnecessary costs, remove obstacles and promote a course of action that will ensure the development of value alternatives. Justify this statement by evaluating the techniques. [2002/60m/6]
Significance of Materials Management in a developing economy with particular reference to our country. [2001/20m/200w/5d]
How does Value Analysis differ from Value Engineering? What are the objectives of value analysis? Explain the modern approach to value analysis. [2001/60m/6]
Make or buy decisions are to be taken initially at the project stage and subsequently often during the operational stage of an enterprise. Do you agree? Give reasons for your reasons. Also state how the related decisions are taken giving appropriate illustrations. [1998/30m/5a]
Define the functions of materials management department How will you judge its effectiveness? [1997/30m/6a]
Despite idle capacity in the production shop, a firm may prefer to buy. Also a firm may prefer to make, even in the face of calculations indicating higher costs as compared to buying costs. Give your comments on the merits of such decisions. [1997/30m/6b]
Why is value analysis done? How is it different from quality control? [1996/30m/5b]
2.14] Inventory control and MRP
33 questions
A manufacturing firm has received an offer for a particular component according to the following discount pricing schedule provided by the supplier:
| 1–199 | ₹66 per unit |
| 200–599 | ₹60 per unit |
| 600+ | ₹55 per unit |
The firm uses 800 components annually. The annual carrying cost is ₹15 per unit. The ordering cost is ₹300 per order. Determine the amount the firm should order. [2026/15m/3b]
A company has an annual demand of 1600 units for an item, whose unit cost is ₹70/-. The annual holding cost comprises 18% for interest charges, 1% for insurance, 1.5% allowances for obsolescence of unit cost and ₹2.50 for building overheads, ₹3.40 for damage loss, and ₹7.0 miscellaneous costs. Placing each order costs the company ₹100/-. (i) Calculate Economic Order Quantity (EOQ) and the total costs of stocking the units. (ii) If the supplier of the items will only deliver batches of 250 units, how is the total variable cost influenced? (iii) If the supplier relaxes their order size requirements, as the company has limited storage space it can stock a maximum of 100 units at any time. What would be the optimal ordering policy and associated costs? [2025/15m/3a]
Outline the objectives of ‘Material Requirements Planning (MRP)’ and explain how an MRP system can achieve these objectives. [2022/10m/1e]
An engineering firm has determined that for a particular part, the cost of purchase is ₹ 350 per order and ₹ 22 per part. Its inventory carrying cost is 15% of the average inventory. The firm currently purchases ₹ 2,20,000 worth of this part every year.
(i) Determine the Economic Order Quantity (EOQ). [2021/5m/1d(i)]
(ii) What is the optimum number of days supply per optimum order? [2021/5m/1d(ii)]
“Inventory Control is a rational process in which decision-making is often done irrationally.” Explain. [2021/5m/2c(ii)]
Morton Confectioners buy plastic boxes in bulk and use them to pack biscuits. Annual requirement for the boxes is 1,350 and each box costs ₹ 33. Ordering cost is estimated to be ₹ 11 per order and carrying cost is 22% of the cost of the box. • How many boxes should be ordered at a time so as to minimise the expenses? (Take nearest whole number) (3) • Mention three assumptions that are associated with the formula used. (2) • If the supplier sells the boxes only in lots of 25, should the company buy 50 or 75? (5) [2020/10m/3b(ii)]
What is Enterprise Resource Planning (ERP)? What are the differences between an ERP system and multiple software applications? What are the differences between Material Requirements Planning (MRP I) and Manufacturing Resource Planning (MRP II)? [2020/20m/4a]
(i) Discuss the different types of inventory owned by a business and state the costs associated with inventory. (ii) Items purchased from a vendor cost ₹ 20 each and the forecast for next years’ demand is 1,000 units. If it costs ₹ 5 every time an order is placed for more units and the storage cost is ₹ 4 per unit per year, what quantity should be ordered each time? I. What is the total ordering cost for a year? II. What is the total storage cost for a year? [2019/15m/4b]
(i) Why do items managed or procured by an organisation need to be classified? How does ABC analysis help the organisation in this regard? (ii) What trade-offs are involved while determining economic order quantity for an organisation? (iii) As part of an insurance company’s training program, participants learn how to conduct an analysis of clients’ insurability. The goal is to have participants achieve a time in the range of 30 to 45 minutes. Test results for three participants were: Shyam, a mean of 38 minutes and a standard deviation of 3 minutes; Mohan, a mean of 37 minutes and a standard deviation of 2.5 minutes and Kaushik, a mean of 37.5 minutes and a standard deviation of 1.8 minutes. Which of the participants would you judge to be capable? Explain. [2018/20m/4c]
ABC Company buys its annual requirements of 36000 units in 6 instalments. Each unit costs ₹ 1 and the ordering cost is estimated as 20% of unit value. Find the total annual cost by the existing inventory policy. How much money can be saved by ‘Economic Order Quantity’ model? [2017/5m/1c(i)]
The daily demand for a component assembly item is normally distributed with a mean of 120 and standard deviation of 15. Furthermore, the source of supply is reliable and maintains a constant lead time of 4 days. If the cost of placing the order is ₹ 45 and the annual carrying cost is ₹ 0.75/unit, find out the economic order quantity and the reorder point to provide a 95% service level. The firm operates 5 days/week, 52 weeks/year. [2016/10m/2c(ii)]
Given the following product structure of A; explode, offset and determine the gross and net requirements. All lead times (LT) are in weeks and the quantities required are shown in parentheses. The MPS calls for 700 units of product A, to be delivered in week 12. The company has in hand 300 units of each of the components C and E. Determine the order release data for all necessary orders.
[Figure: Product structure tree – A (LT = 4) at the top; below A: B(1400) (no lead time shown) and C(1400) LT = 3; below B: D(4200) LT = 2, E(2800) LT = 2 and F(1400) LT = 4] [2016/10m/4b]
A Fast Food outlet stocks frozen pizzas in a refrigerated display case. The average daily demand for the pizzas is normally distributed with a mean of 8 pizzas and a standard deviation of 2.5 pizzas. The outlet operates for 300 days in a year. A vendor for packaged food distributor checks the market’s inventory of frozen foods every 10 days. The lead time to receive the order is 3 days. If the purchase cost of one pizza is Rs. 300, the cost of placing an order for pizza is Rs. 200, what will be the optimal order quantity? What will be the reorder point with a lead time of 3 days and service level of 99%? [2015/10m/1c]
Three models of a product, namely A, B, C are to be supplied by a manufacturing factory to a distribution center. Since the product is shipped by sea, it takes 2 months transportation time for the product to reach the distribution center from the factory. The means and standard deviations of annual demand for the three models are given in Table below. The manufacturing cost of each model in the factory is Rs. 20,000 per unit. The manufacturing cost of the generic, non customized product is also Rs. 20,000 per unit. The inventory carrying cost is Rs. 0.24/Re./Year. The company would like to provide a service level of 99% for each of the models at the distribution center. The company is weighing two options: Option 1: Make each model in the factory and ship to distribution center. Option 2: Build the generic product in the factory and customize the models at the distribution center to make each of the three models. (i) Calculate the safety stocks to be provided under each option and their corresponding total annual inventory carrying costs. (ii) Upto how much amount per year can the company spend in customizing the models at the distribution center? Table: Annual Demand Data for Three Models.
| Model | Mean Annual Demand, Units | Standard Deviation of Annual Demand, Units |
| A | 2,000,000 | 200,000 |
| B | 1,000,000 | 150,000 |
| C | 4,000,000 | 200,000 |
[2015/18m/3b]
Paintkart Internet website stocks and sells paint online on 360 days of a year. Paintkart store stocks several brands of paint; however, its biggest brand is WeWe paint. WeWe paint has an estimated annual demand of 10000 litres of paint, an annual carrying cost of ₹ 0.75 per litre, and an ordering cost of ₹ 150 per order. Assuming that the demand is uniform and is known with certainty, lead time for receipt of orders is constant and certain, answer the following: (i) What is the optimal order size (in litres) for the WeWe paint? (ii) What is the minimum total inventory cost for the WeWe paint? (iii) What is the number of orders per year for optimal ordering policy? (iv) What is the time between two orders (i.e., the order cycle)? (v) If the lead time is 9 days, what is the reorder level? [2014/15m/3b]
Product A is assembled from two parts B and C. One unit of A is assembled from 1 unit of B and 2 units of C. Each item requires one or more operations and the lead time everywhere is assumed negligible. Part C requires first machining operation followed by heat treatment. Part B requires only machining operation. Product A requires an assembly operation. The Master Production Schedule (MPS) for product A is given in the table below:
| Month | 1 | 2 | 3 | 4 | 5 | 6 |
| Product A (in units) | 100 | 150 | 100 | 200 | 125 | 100 |
The process time data is shown in the table below:
| Operation | Item | Work center | Standard time/unit (in hr) |
| 10 | C | Machining | 0.5 |
| 20 | C | Heat treatment | 2.0 |
| 30 | B | Machining | 1.0 |
| 40 | A | Assembly | 0.5 |
(i) What will you recommend as normal capacity at each work center? (ii) If the setup cost to produce a batch of product A is ₹ 5,000, the manufacturing cost of the product A is ₹ 2,000 per unit and the inventory holding cost per unit per year is 20% of the product cost, what Master Production Schedule (MPS) will you recommend to minimize sum total of setup and inventory holding costs? (iii) Given the MPS in the table above, what is the schedule of gross requirements of part C? [2013/20m/3a]
Assuming 52 working weeks in a year, what will be the sum total of ordering and inventory carrying costs for the digital display unit, with the present ordering policy? [2012/8m/200w/2a]
What will be the stock level at which an order should be placed, with the present ordering policy? [2012/12m/200w/2b]
If the company wanted to minimize the sum total of annual ordering and inventory carrying costs, what should the company’s order quantity be for the display unit? [2012/15m/200w/2c]
How much safely stock should the company provide if the company wanted to ensure that it will not run out of stock more than 1% of inventory cycles? [2012/12m/200w/2d]
In the general context of vendors, distinguish between MRP and JIT, with illustrations. [2012/13m/200w/2e]
Explain how purchasing was improved. What functions does MRP perform? How is this improved by automation? [2011/20m/2ii]
Distinguish between the V-E-D and the F-S-N classification schemes of materials. [2010/10m/2c]
Product A consists of two units of subassembly B, three units of C, and one unit of D. B is composed of four units of E and three units of F. C is made of two units of H and three units of D. H is made of five units of E and two units of G. (i) Construct a simple bill of materials, in the form of product structure tree. (ii) Construct an indented parts list. (iii) To produce 100 units of A, determine the number of units of B, C, D, E, F, G and H required. [2010/30m/3a]
The Material Requirement Plan (MRP) gross requirements for item X are given below for the next 10 weeks. The lead time for X is two weeks, and the setup cost is Rs. 9. There is an inventory carrying cost of Rs. 0.02 per unit per week. Beginning inventory is 70 units.
| Week | Gross Requirements |
| 1 | 20 |
| 2 | 10 |
| 3 | 15 |
| 4 | 45 |
| 5 | 10 |
| 6 | 30 |
| 7 | 100 |
| 8 | 20 |
| 9 | 40 |
| 10 | 150 |
Use the least total cost or the least unit cost lot-sizing method to determine when and for what quantity the first order should be released. [2010/30m/3b]
Inventory Control Techniques. [2007/20m/200w/1d]
Two Bin System. [2007/20m/200w/5d]
Good inventory management is the backbone of an industry’s managerial effectiveness. Explain this statement and also discuss various techniques of inventory management. [2006/60m/6]
Importance of Inventory Control under the present circumstances of India. [2001/20m/200w/5a]
ABC Analysis classifies the items of inventory on the basis of number of units consumed over the year, and on the basis of value per unit. Therefore, ABC Classification for the current year may not serve its purpose in the future years. Do you agree? Give reasons and example (s) in support of your answer. [2000/30m/7a]
Critically examine the assumptions of Economic Order Quantity (EOQ) model and explain the methods of protecting against variations in usage rate and supply lead time. [2000/30m/7b]
What is meant by ABC classification? How might on organisation’s inventory be analysed using the ABC classification? [1995/30m/6a]
What is the relationship between inventory control and the determination of economic order quantities? [1995/30m/6b]
2.15] Waste management
3 questions
State the different forms of waste management. [2023/15m/3a]
Suggest at least three strategies for better waste management in Indian cities and towns. [2014/5m/1d(i)]
Waste management and environmental protection. [2002/20m/200w/5a]

Strengthen your GS papers
Our UPSC Mains Topic-wise & Year-wise PYQ eBook (2013–2026) maps every GS question to the syllabus, so you know what UPSC asks and how often.
View the BookDownload Free Sample« Previous: Quantitative Techniques in Decision-Making | Next: Management Information System »
Back to: Management Optional PYQs – Topic-wise
Last updated: 30 October 2026