
Here are all 239 Industrial Statistics questions asked in UPSC Statistics Optional Paper II from 1995 to 2026, arranged under the 4 topics of the official syllabus. Within each topic the latest questions come first.
Each question ends with a code such as [2024/15m/3b] – the year, the marks, the word limit (where UPSC set one) and the question number in the paper.
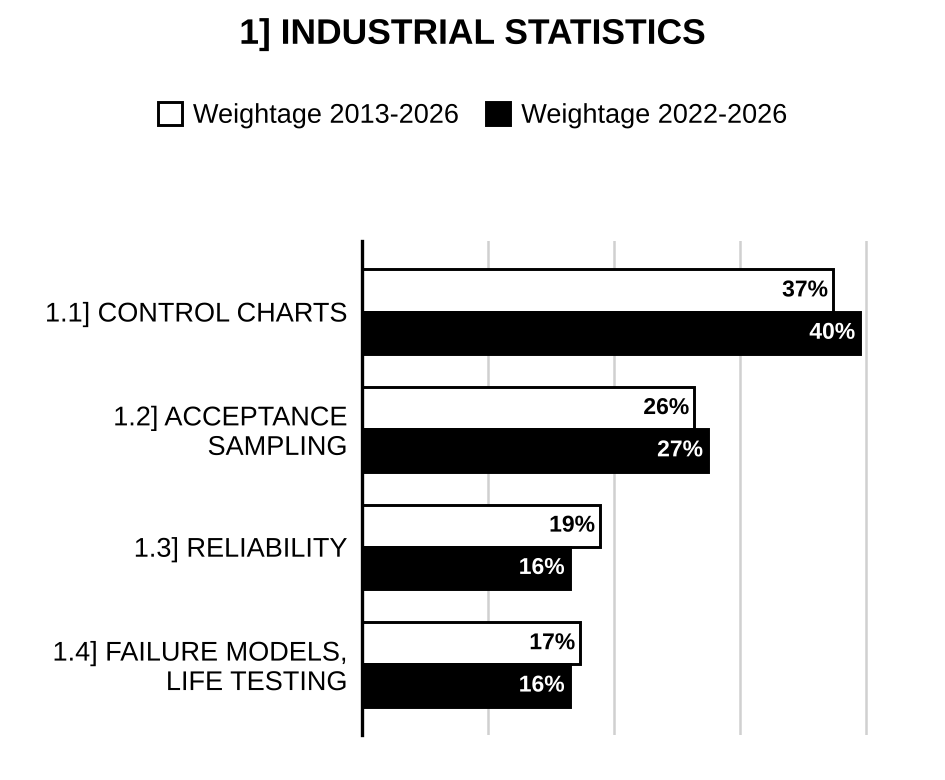
1.1] Control charts
78 questions
Describe the effect of sample size on , R and s charts for the sample sizes , and . [2026/10m/1c]
Describe the construction of a CUSUM chart with Decision interval and Reference value. [2026/10m/2a(i)]
Each day, a sample of 50 items from a production process was examined. The number of defectives found in each sample was as follows: 6, 2, 5, 1, 2, 2, 3, 5, 3, 4, 12, 4, 4, 1, 3, 5, 4, 1, 4, 3, 5, 4, 2, 3. Draw a suitable control chart and check for control. What control limits would you suggest for subsequent use? [2026/15m/3b]
State the significance of operating characteristic (OC) curves in control chart analysis. Obtain the general expression for the OC function corresponding to the mean chart under the assumption of normal distribution for a quality characteristic. Using the expression, find the probability that a shift will be detected from to , when an chart is used with limits, where the subgroup size is . (Standard normal table is provided.) [2025/10m/1a]
What are control charts by variables and control charts by attributes? [2025/5m/2a(i)]
Derive the control limits for the construction of control charts for the mean and variability based on sample standard deviation. [2025/15m/2a(ii)]
Distinguish between a nonconforming unit and a nonconformity. State the appropriate conditions for constructing a control chart for nonconformities and derive the control limits for a control chart based on the average number of nonconformities per inspection unit. [2025/10m/4c(i)]
Describe the procedure and some of the applications of Cumulative Sum (CUSUM) chart for monitoring process mean. [2024/10m/1b]
Obtain the control limits for -chart and R-chart and describe the significance of joint study of these charts. [2024/20m/2a]
(i) Explain the terms ‘chance causes’ and ‘assignable causes’ of variation in quality control. Also provide some principal advantages of statistical quality control. (ii) Describe the procedure of obtaining OC curve for single sampling plan. [2024/20m/4c]
What do you understand by Statistical Quality Control (SQC)? Discuss briefly its need and utility in Industry. Discuss the causes of variation in quality. [2023/10m/1a]
What do you understand by control chart for fraction defective? Explain its construction. Give the theoretical distribution on which the control limits are based. [2023/15m/2a]
Each day a sample of 50 items from the production process was examined. The number of defectives found in each sample was as follows:
| Day | 1 | 2 | 3 | 4 | 5 | 6 | 7 | 8 | 9 | 10 | 11 | 12 |
| No. of Defectives | 6 | 2 | 5 | 1 | 2 | 2 | 3 | 5 | 3 | 4 | 12 | 4 |
| Day | 13 | 14 | 15 | 16 | 17 | 18 | 19 | 20 | 21 | 22 | 23 | 24 |
| No. of Defectives | 4 | 1 | 3 | 5 | 4 | 1 | 4 | 3 | 5 | 4 | 2 | 3 |
Draw a suitable control chart and check for control. What control limits would you suggest for subsequent use? [2023/15m/2b]
Distinguish between process control and product control. Explain the various sources of variation encountered in a process control study. Suggest how they can be eliminated from the process. [2022/10m/1a]
Samples of size units are taken from a process every hour. The and values for a particular quality characteristic are determined. After 25 samples have been collected, we obtain and . (i) What are the three-sigma control limits for and ? (ii) Estimate the process standard deviation if both the charts exhibit control. (iii) Assume that the process output is normally distributed. If the specifications are , what are your conclusions regarding the process capability? (iv) If the process mean shifts to 24, what is the probability of not detecting this shift on the first subsequent sample? () [2022/15m/2a]
.
| Item No. | No. of defects | Item No. | No. of defects |
| 1 | 2 | 11 | 6 |
| 2 | 0 | 12 | 0 |
| 3 | 4 | 13 | 2 |
| 4 | 1 | 14 | 1 |
| 5 | 0 | 15 | 0 |
| 6 | 8 | 16 | 3 |
| 7 | 0 | 17 | 2 |
| 8 | 1 | 18 | 1 |
| 9 | 2 | 19 | 0 |
| 10 | 0 | 20 | 2 |
The number of defects on 20 items were recorded as given above: Use a suitable control chart to identify whether the process is in control or not? [2021/15m/2b]
A machine is set to deliver the packets of a given weight. Ten samples of size 5 each were examined and the following results were obtained:
| Sample No. | 1 | 2 | 3 | 4 | 5 | 6 | 7 | 8 | 9 | 10 |
| Mean | 43 | 49 | 37 | 44 | 45 | 37 | 51 | 46 | 43 | 47 |
| Range | 5 | 6 | 5 | 7 | 7 | 4 | 8 | 6 | 4 | 6 |
Use mean and range charts to check whether process is under control. (Given for , and ) [2021/20m/4c]
Differentiate between process control and product control with examples. [2020/10m/1e]
What are control charts for attributes? Discuss and charts. The following data refer to number of defectives in 10 samples each of size 100 items. Construct an appropriate control chart and interpret the control limits:
| Sample No. | 1 | 2 | 3 | 4 | 5 | 6 | 7 | 8 | 9 | 10 |
| No. of Defectives | 4 | 8 | 11 | 3 | 11 | 7 | 7 | 16 | 12 | 6 |
[2020/20m/2c]
In usual notations, write the control limits for -chart. If the th sample mean is the first to exceed UCL, obtain . [2019/10m/1c]
Describe a CUSUM control chart. Compare this chart with a Shewhart chart with respect to performance. A machine produces spokes for the wheels of bicycles. When the process is in control, the machine produces spokes whose lengths are normally distributed about mean 25.000 cm and standard deviation 0.020 cm. At regular intervals, a sample of 5 spokes is taken and their lengths are measured. Use (i) Shewhart -chart and (ii) CUSUM -chart to investigate whether the machine is correctly set on the basis of the following data:
| Sample | 1 | 2 | 3 | 4 | 5 |
| Mean | 24.998 | 25.016 | 25.024 | 25.022 | 24.984 |
| Sample | 6 | 7 | 8 | 9 | 10 |
| Mean | 25.012 | 25.024 | 24.978 | 25.012 | 25.017 |
| Sample | 11 | 12 | 13 | 14 | 15 |
| Mean | 25.024 | 25.026 | 25.027 | 25.028 | 25.028 |
[2019/15m/2b]
Explain the theoretical basis for control charts. [2018/10m/1c]
Control charts for and are maintained for an important quality characteristic. The sample size is ; and are computed for each sample. After 35 samples, we have found that (i) Compute the central line and control limits for and charts. (ii) Assuming both charts exhibit control, estimate the process mean and standard deviation. (iii) If the quality characteristic is normally distributed and if the specification limits are , estimate and . (Given: , , , ) [2018/20m/3c]
The following figures give the number of defectives in 20 samples each containing 2000 items: 305, 425, 430, 216, 341, 225, 322, 280, 306, 337, 356, 402, 216, 264, 126, 409, 193, 326, 280, 390 Can we conclude that the process is in control by setting up an appropriate control chart in a graph sheet? [2018/15m/4a]
Explain (i) Natural tolerance limits (ii) Trial control limits (iii) Specification limits (iv) Modified control limits. [2017/10m/1a]
Samples of size 4 are drawn to construct a control chart for . The central line is at 100 and LCL and UCL are at 96 and 104 respectively. If the measured characteristic is normally distributed with mean of 98 and standard deviation of 4, what is the probability that the control chart will raise an out-of-control alarm at the fourth sample? [2017/15m/3a]
In a capability study of a process involving manufacturing items, the specification limits are given as . From the manufactured items, six items were selected each day consecutively for eight days. The measurements obtained are given below in excess of 23. (That is, for example, the first cell value 0.77 should be read as 23.77).
| Day | 1 | 2 | 3 | 4 | 5 | 6 | 7 | 8 |
| Measurements | 0.77 | 0.80 | 0.77 | 0.79 | 0.75 | 0.78 | 0.76 | 0.76 |
| 0.80 | 0.78 | 0.78 | 0.76 | 0.78 | 0.76 | 0.78 | 0.79 | |
| 0.78 | 0.76 | 0.77 | 0.79 | 0.78 | 0.73 | 0.75 | 0.77 | |
| 0.73 | 0.70 | 0.77 | 0.74 | 0.77 | 0.76 | 0.76 | 0.72 | |
| 0.76 | 0.81 | 0.80 | 0.82 | 0.76 | 0.81 | 0.81 | 0.78 | |
| 0.75 | 0.77 | 0.74 | 0.76 | 0.79 | 0.80 | 0.80 | 0.78 |
(i) Construct and charts. (ii) Compute the process capability of the machine. (iii) Will the process meet the specifications? (The table values are: , , , ) [2017/20m/4a]
What are the different control charts for attributes used in industrial inspection of manufactured units? The following table gives the results of inspection of 10 pieces of woollen goods. Calculate the control chart for the number of defects and comment whether the process is under control or not.
| Piece No. | 1 | 2 | 3 | 4 | 5 | 6 | 7 | 8 | 9 | 10 |
| Number of Defects | 4 | 3 | 6 | 3 | 0 | 1 | 3 | 5 | 7 | 8 |
[2016/20m/3a]
Explain the term ‘control’ in connection with Statistical Quality Control. Distinguish between Process control and Product control. [2015/10m/1a]
What do you mean by “process is statistically controlled”? How to detect lack of control using a control chart? State the control limits for fraction defective control chart when population proportion is unknown and sample sizes are (i) fixed and (ii) variable. [2015/15m/2b]
Describe a CUSUM control chart. Compare this chart with a Shewhart chart with respect to performance. How is a V-mask useful in CUSUM charts? [2014/10m/1a]
Describe the principles on which a control chart is based. What is the concept behind the use of limits in statistical quality control? Control on measurements of pitch diameter of threads in aircraft fittings is checked with 5 successive items measured at regular intervals. 8 such samples are given below: (Values are expressed in units of 0.0001 inch)
| Sample | Measurement on each item of 5 items per hour | ||||
| 1 | 46 | 45 | 44 | 43 | 42 |
| 2 | 41 | 41 | 45 | 42 | 41 |
| 3 | 40 | 40 | 43 | 42 | 40 |
| 4 | 42 | 43 | 43 | 42 | 45 |
| 5 | 42 | 44 | 47 | 47 | 45 |
| 6 | 39 | 46 | 45 | 42 | 41 |
| 7 | 46 | 44 | 41 | 40 | 45 |
| 8 | 40 | 45 | 43 | 40 | 39 |
Construct the chart and comment on the process control. [2014/20m/3b]
What is meant by Statistical Quality Control (SQC)? What is its main purpose? Give its uses. Also mention different tools for SQC. [2013/10m/1a]
Explain different steps in the preparation of Control Charts. [2013/10m/1c]
In welding of seams, number of defects that were identified in one seam each hour are given below: 2-1-2013.
| 6 am | 7 am | 8 am | 9 am | 10 am | 11 am | 12 noon | 1 pm | 2 pm | 3 pm | 4 pm | 5 pm | 6 pm |
| 2 | 4 | 7 | 3 | 1 | 4 | 8 | 9 | 5 | 3 | 7 | 11 | 6 |
3-1-2013
| 6 am | 7 am | 8 am | 9 am | 10 am | 11 am | 12 noon | 1 pm | 3 pm | 4 pm | 5 pm |
| 4 | 9 | 9 | 6 | 4 | 3 | 9 | 7 | 4 | 7 | 12 |
Draw the control chart for number of defects and give your conclusion. [2013/20m/2c]
Describe how the control chart based on sample ranges is constructed. [2012/12m/1c]
A sample of 100 screws was selected on each of 25 successive days in a factory manufacturing screws, and each screw was examined for defects. The data for number of unacceptable screws on different days are given below:
| Day | No. of defective screws | Day | No. of defective screws |
| 1 | 7 | 14 | 6 |
| 2 | 4 | 15 | 2 |
| 3 | 3 | 16 | 9 |
| 4 | 6 | 17 | 7 |
| 5 | 4 | 18 | 6 |
| 6 | 9 | 19 | 7 |
| 7 | 6 | 20 | 11 |
| 8 | 7 | 21 | 6 |
| 9 | 5 | 22 | 7 |
| 10 | 3 | 23 | 4 |
| 11 | 7 | 24 | 8 |
| 12 | 8 | 25 | 6 |
| 13 | 4 |
Assume that the production process was in control during the period. Determine the upper and the lower control limits (UCL and LCL) based on this data for the proportion of defective items. [2012/30m/3a]
Construct a control chart for and from the following data on the basis of samples of 5 being taken every hour (each set of 5 has been arranged in ascending order of magnitude). Comment on the state of control. What will be the future control limits for and charts?
| 42 | 42 | 19 | 36 | 42 | 51 | 60 | 18 | 15 | 69 | 64 | 61 |
| 65 | 45 | 24 | 54 | 51 | 74 | 60 | 20 | 30 | 109 | 90 | 78 |
| 75 | 68 | 80 | 69 | 57 | 75 | 72 | 27 | 39 | 117 | 93 | 94 |
| 78 | 72 | 81 | 77 | 59 | 78 | 95 | 42 | 54 | 118 | 109 | 109 |
| 87 | 90 | 81 | 84 | 78 | 132 | 135 | 60 | 62 | 153 | 112 | 139 |
Table Value: For : , , [2011/20m/4b]
The following data (pertaining to two sub-groups of size 4), is from two different machines which are supposed to be alike. Plot the necessary charts to show whether their product would support this assumption. If they do not support this assumption, does this prove the machines are not essentially alike?
| Subgroup No. | Machine-I Average | Machine-I Range | Machine-II Average | Machine-II Range |
| 1 | 2·77 | 0·06 | 2·53 | 0·12 |
| 2 | 2·7 | 0·29 | 2·67 | 0·3 |
| 3 | 2·78 | 0·19 | 2·66 | 0·17 |
| 4 | 2·67 | 0·12 | 2·57 | 0·25 |
| 5 | 2·75 | 0·34 | 2·6 | 0·24 |
| 6 | 2·77 | 0·23 | 2·6 | 0·05 |
| 7 | 2·75 | 0·17 | 2·7 | 0·3 |
| 8 | 2·73 | 0·06 | 2·56 | 0·04 |
| 9 | 2·76 | 0·23 | 2·7 | 0·19 |
| 10 | 2·63 | 0·2 | 2·67 | 0·08 |
| 11 | 2·73 | 0·17 | 2·6 | 0·11 |
| 12 | 2·73 | 0·28 | 2·63 | 0·14 |
| 13 | 2·74 | 0·26 | 2·71 | 0·24 |
| 14 | 2·72 | 0·13 | 2·63 | 0·31 |
| 15 | 2·73 | 0·13 | 2·75 | 0·17 |
Table values:
| 3 | 4 | 5 | |
| 1·693 | 2·059 | 2·526 | |
| 1·02 | 0·73 | 0·58 |
[2010/20m/4b]
Describe a CUSUM control chart. Compare this chart with a Shewhart chart with respect to performance. How is a V-mask useful in CUSUM charts? [2009/12m/1d]
Explain assignable and chance causes of variation. Describe the principles on which a control chart is based. Describe chart and mention its advantages and disadvantages over chart. [2009/20m/4c]
Explain the construction of and r-charts. Why are both the charts used simultaneously? [2007/12m/1a]
Explain the construction and use of cumulative sum chart. [2007/25m/2a]
Distinguish between (i) chance causes and assignable causes and (ii) specification limits and control limits. [2006/12m/1a]
What is a CUSUM chart and where is it used? How does it differ from a Shewhart control chart? [2006/12m/1b]
Explain clearly the basis and working of control chart for mean and range. Give interpretation of and R charts. [2006/15m/4a]
Distinguish between Process Control and Product Control. How do we achieve them? [2005/12m/1a]
Obtain the OC function of control chart. Explain its use. [2005/12m/1b]
Explain the construction and use of c-chart. [2005/25m/2a]
With reference to control charts, distinguish between (i) warning limits and action limits, and (ii) Type I and Type II errors. [2004/12m/1a]
Explain the construction and use of and R charts. [2004/12m/1b]
Explain the statistical basis and construction of p and np charts. [2004/25m/2a]
What are trial control limits? What is done if a point is found outside trial control limits? Explain why periodic revision of control limits and central line of a control chart is necessary. [2003/12m/1a]
What is the V-mask procedure? Is it useful for a one-sided process monitoring problem? If not, why? [2003/12m/1b]
Explain how are the and the R charts maintained. Discuss why it is important to maintain both of these simultaneously. [2003/25m/2c]
Distinguish between process control and product control. Discuss the advantages of process control. [2002/12m/1a]
Describe the procedure for setting up control chart for proportion defective for varying sample size. [2002/12m/1b]
Explain the following terms: (i) specification limits, (ii) tolerance limits, (iii) control limits and (iv) warning limits. A machine is to manufacture plugs to a nominal diameter of inches. Ten samples, each of size 5, were taken from online production and the following statistics were obtained:
| Sample number | Sample mean | Sample range |
| 1 | 0.4952 | 0.017 |
| 2 | 0.4962 | 0.016 |
| 3 | 0.5032 | 0.028 |
| 4 | 0.5014 | 0.023 |
| 5 | 0.5021 | 0.018 |
| 6 | 0.5018 | 0.038 |
| 7 | 0.4960 | 0.011 |
| 8 | 0.4952 | 0.012 |
| 9 | 0.5036 | 0.020 |
| 10 | 0.4988 | 0.013 |
Set up control charts for mean and range and comment if the manufacturing process meets the specifications. Calculate warning limits for mean. (For , , , ) [2002/20m/2a]
Explain the concept of rational sub grouping for control chart purpose. Describe two schemes based on order of production in this context. [2001/12m/1a]
Explain the statistical basis of a p-chart. Describe its construction when the subgroup size n is (i) fixed and (ii) varying. [2001/20m/2a]
What is a CUSUM control chart? How are the parameters of the V-mask for such a chart determined? [2001/15m/4a]
Explain how you will detect lack of statistical control in a manufacturing process using a control chart. [2000/12m/1a]
Distinguish between the p- and the np-charts. Also explain the construction and operation of the latter. [2000/15m/2c]
What are and R charts? When are they used? Explain how they are constructed and analyzed. Also explain how you would estimate the process standards using these charts. [2000/15m/4a]
What is meant by statistical quality control? What does it aim to achieve? Does a statistically controlled process always meet specifications? Explain. [1999/30m/1a]
Describe the common control charts in use. How do you measure the efficiency of a control chart? [1999/30m/1b]
Describe the importance of normal distribution in the theory of quality control. [1998/15m/5a]
Distinguish between ‘Process Control’ and ‘Product Control’ Examine the basis of the p-chart and explain the approximations and assumptions involved and how they are met in actual plant conditions. [1998/30m/5b]
Distinguish between chance and assignable causes of variation. [1998/15m/5c]
Explain the construction and use of and R charts when the process standards are (i) given and (ii) not given. How will you estimate the process standard deviation from the chart? [1997/20m/5a]
Distinguish between assignable and chance causes of variation in the quality of a manufactured item. When is a manufacturing process said to be in statistical control? How will you find out whether a manufacturing process is in statistical control or not? [1997/20m/5b]
Describe CUSUM charts, stating their advantages and limitations. Describe the decision interval scheme and the V-mask procedure used in CUSUM charts. Also show that these schemes are equivalent. [1997/20m/5c]
Explain the significance of the following concepts in the construction of control charts. (i) Assignable causes of quality variation (ii) Rational subgroups. [1996/20m/5a]
Describe briefly the construction and working of a CUSUM chart for a variable characteristic. [1996/20m/5b]
When and how is a np-chart useful? What is the statistical basis of this chart? [1996/20m/5c]
Explain and statistical basis of p and c charts. [1995/20m/5a]
In a manufacturing process it is assessed that the mean has a steady declining trend, though the standard deviation could be taken to be constant. Explain how you would modify the construction of the chart for subgroup means. [1995/20m/5b]
Explain how a CUSUM chart can be used to detect upward shifts in the process mean. [1995/20m/5c]
1.2] Acceptance sampling
63 questions
Construct a single sampling plan for attributes, given the following data: A.Q.L. = 0·05 Producer’s risk = 0·05 Consumer’s risk = 0·10 LTPD = 0·20. [2026/10m/1b]
How will you draw the OC curve for a single sampling plan with sample size 5, if the acceptance number is , assuming the lot size to be large? Explain. [2026/15m/3a]
Discuss the theoretical basis of the sequential probability ratio test (SPRT) in acceptance sampling. Explain how acceptance and rejection numbers are chosen to satisfy and risks. [2026/15m/4a(i)]
What is meant by rectifying inspection? Explain the measures associated with rectifying inspection and derive the expressions of such measures in the case of a single sampling plan by attributes. [2025/10m/1b]
State the assumptions involved under sampling inspection plans by variables and describe the operating procedure of a single sampling plan by variables under the assumption of normal distribution for a quality characteristic. [2025/5m/2b(i)]
Establish the relationship between the fraction defective and the acceptance probability under a single sampling plan by variables when the quality characteristic follows a normal distribution with mean and variance , where is unknown, and when an upper specification limit is specified. Using the relationship, obtain the formula for finding the parameters of the sampling plan. [2025/10m/2b(ii)]
Describe the operating procedure of unit-by-unit sequential sampling plan by attributes. What is the unique feature of a sequential sampling plan? [2025/5m/4c(ii)]
Explain the following terms as used in sampling inspection plans: (i) Producer’s risk (ii) Average Outgoing Quality Limit. [2024/10m/1c]
(i) Explain the terms ‘chance causes’ and ‘assignable causes’ of variation in quality control. Also provide some principal advantages of statistical quality control. (ii) Describe the procedure of obtaining OC curve for single sampling plan. [2024/20m/4c]
A company uses the following acceptance-sampling procedure–A sample equal to 10% of the lot is taken. If 2% or less of the items in the sample are defective, the lot is accepted, otherwise it is rejected. If the submitted lot varies in size from 5000 units to 10000 units, what can you say about the protection by this plan? If 0.05 is the LTPD, does this scheme offer reasonable protection to the consumer? [2022/20m/2c]
What are sequential sampling plans? Suggest a sequential sampling plan for which and . [2022/15m/4c]
Explain Single Sampling Plan with the help of an example. Also, write the importance of an Operating Characteristics Curve in a sampling plan. [2021/10m/1a]
Explain the concepts of producer’s and consumer’s risks. It has been decided to sample 100 items at random from each large batch. We reject the batch if more than 2 defectives are found. If the acceptable quality level is 1% and the unacceptable quality level is 5%, then find the producer’s and consumer’s risks. [2021/20m/2c]
What are sampling plans? Define consumer’s risk, producer’s risk and OC curve. In a double sampling plan with , , , and , explain how you would draw your conclusion. [2020/15m/2a]
Explain double sampling plan briefly. Write the formulae for obtaining ASN and ATI for double sampling plan. [2019/10m/1b]
Draw OC curve and ASN curve for the following two sampling inspection plans. Assume large lot sizes and take values of as with increment of 0.2:
| Sampling Plan No. | Sampling No. | Sample Size | Combined Sample Size | Acceptance No. | Rejection No. |
| 1 | 1st | 5 | 5 | 1 | 2 |
| 2 | 1st | 3 | 3 | 0 | 2 |
| 2 | 2nd | 6 | 9 | 1 | 2 |
[2019/15m/4c]
In a single sampling plan (1000, 89, 2), compute the probability of acceptance of the lot if the lot fraction defective is 0.01. Also compute Average Outgoing Quality (AOQ) of the lot. [2018/15m/4c]
For a single sampling plan, , compute the probability of acceptance of lots of 50 articles with 2% defective. [2017/10m/1c]
What are Average Sample Number (ASN) and Average Total Inspection (ATI)? Explain the method of their calculation for a single sampling plan. [2016/10m/1d]
Describe the single and double sampling plans used in acceptance sampling. Define the operating characteristic function of a sampling plan. [2016/15m/3c]
State the single sampling plan for attributes. Explain Dodge-Romig system of determination of plan parameters for (i) LTPD plans and (ii) AOQL plans. [2015/15m/2a]
Explain the concept of sequential sampling plan for attributes and obtain the average sampling number function of a sequential sampling plan for testing the hypothesis against the alternative hypothesis in sampling from a population with density function . [2014/15m/2a]
Explain the terms (i) Acceptance quality level (ii) LTPD (iii) Consumers’ risk (iv) Producers’ risk (v) OC curve. [2014/10m/4b]
Suppose that the purchaser and the ender agree that a defective rate of 10% in a lot is satisfactory. For the sampling plan (, , ), determine the probability that a lot with this per cent (i.e. 10%) defective, will be accepted. Also determine the said probability if the sampling plan happens to be , , . Which of these two sampling plans seems better and why? [2014/20m/4c]
Explain Double sampling Plan and develop expression required for drawing OC curve in Double sampling Plan. [2013/15m/2a]
Explain the procedure for drawing the 5-points A S N curve for the sequential sampling plan. [2013/15m/2b]
Describe single and double sampling plans used in acceptance sampling. Define the operating characteristic function of a sampling plan. [2012/12m/1a]
Consider an acceptance sampling plan where 50 items sampled from a huge lot will be examined and the lot will be accepted it at most two of the sampled items are found defective – otherwise the lot will be rejected. Evaluate the acceptance probability as a function of the proportion of defectives in the lot and sketch the Operating Characteristic (OC) curve. (Only a rough sketch is required and no graph paper is necessary) [2012/30m/3b]
State the procedure for double sampling attributes plan for lot disposition. Also derive its OC and ASN functions. [2011/12m/1c]
What is rectifying inspection plan? Obtain the expressions for AOQ and ATI, with reference to a single sampling plan for attributes. [2010/12m/1c]
What do you mean by acceptance sampling plans? Between a single sampling plan with , and a double sampling plan with , , , , can it be said that the second inspection scheme is more economical than the first? Give reasons justifying your answer. [2009/20m/2c]
Explain the construction and use of sequential sampling plans for attributes. [2007/12m/1b]
Distinguish between multiple and sequential sampling plans. Derive the OC function and ASN of a double sampling plan under corrective sampling scheme. [2007/15m/4a]
Describe a double sampling plan for attributes. Derive the expressions for OC, ASN & ATI of this plan. [2006/20m/2a]
Explain the construction and use of sampling plans for stipulated producer’s and consumer’s risks. How do we choose the best sampling plan? [2005/15m/4a]
What do you understand by sampling inspection plan for variables? Explain how it differences from the sampling inspection plan for attributes. State the use of Dodge-Romig tables. [2004/15m/4a]
Derive the OC function of a single sampling inspection plan. Define AQL and LTPD corresponding to a lot. Explain how to choose a plan with specified values of AQL and LWD. [2003/12m/1c]
Explain the concepts of (i) producers risk, (ii) consumer’s risk. (iii) average outgoing quality limit (AOQL) and (iv) average total inspection (ATI). Give significance of AOQL and ATI in acceptance sampling plans. [2002/12m/1c]
Derive single sampling inspection plan for variables when the upper specification limit is specified and the operating characteristic curve passes through two fixed points: (AQL, ) and (LTPD, ). You may assume that the lot quality characteristic is normally distributed and the standard deviation is known. [2002/20m/2b]
Explain the concept of sequential sampling inspection plan for attributes, In testing and (where p is proportion of defective items in a lot), determine acceptance and rejection lines. [2002/15m/4a]
Derive an unknown sigma variable sampling plan when there is only an upper specification limit on the quality characteristic in acceptance sampling. [2001/12m/1b]
Describe the double sampling attributes plan for lot disposition. Derive its OC and ASN functions. What is curtailed inspection? [2001/20m/2b]
Explain the concepts of AOQ and ATI for rectifying inspection by attributes. What is AOQL? [2001/15m/4b]
Given , , and (usual notations), obtain the item by item sequential sampling plan for attributes. [2000/12m/1b]
Explain the terms AOQ and ATI. For a double Sampling attributes plan with rectifying inspection derive the expressions for the AOQ and the ATI. [2000/20m/2a]
Write a brief note on MIL-STD-414 tables. [2000/15m/4b]
Discuss the relative advantages of double sampling plans over single sampling plans. [1999/20m/2a]
Explain the concepts of producer’s and consumer’s risks, AOQL and LTPD. [1999/20m/2b]
Describe the construction and use of Dodge-Romig tables. [1999/20m/2c]
Explain single and double sampling inspection plans for attributes. What are the statistical advantages of double sampling plan? [1998/15m/6a]
Given lot size (N), LTPD , consumer’s risk and process average [?], derive the most economical single sampling plan for acceptance purposes. [1998/30m/6b]
Define AOQL and describe how to obtain the same for the double sampling plan. [1998/15m/6c]
Write a note on sequential sampling inspection plans for attributes. [1998/20m/7a]
Distinguish between type A and type B OC curves with reference to a single sample attribute inspection plan. How are they constructed? [1997/20m/6a]
Obtain a variable sampling plan with double specification limits and with specified values of , , and (usual notations) when the quality characteristic is normally distributed with a known standard deviation. [1997/20m/6b]
What is a sequential sampling plan? Also obtain the formula for the ATE for an item by item SPR plan when rejected lots are inspected one hundred percent. [1997/20m/6c]
Describe the working of a double sampling plan for product control. What are the advantages of this plan as compared to a single sampling plan? [1996/20m/6a]
Define the concepts of AOQ and ATI in rectifying inspection. Derive expressions for these under a double sampling plan. [1996/20m/6b]
Devise a known sigma variables sampling plan when there is a two-sided specification on the quality characteristic. [1996/20m/6c]
Explain the concepts: OC curve, AOQ and consumer’s risk. [1995/20m/6a]
Derive the equations to the acceptance and rejection lines for a sequential sampling plan by attributes whose OC curve passes through the specified points and . [1995/20m/6b]
Describe a double sampling plan fully. [1995/20m/6c]
Discuss the relative merits of attributes and variables sampling plans. [1995/20m/7a]

Preparing for Prelims too?
Our UPSC Prelims Topic-wise PYQ eBook covers every Prelims question with detailed explanations, so you can see exactly where UPSC asks from.
View the BookDownload Free Sample1.3] Reliability
55 questions
Suppose that a given individual in a population has a survival time which is exponential with a hazard rate . Each individual’s hazard rate is potentially different and is sampled from a Weibull distribution with probability density function: Let be the life length of a randomly chosen individual of this population. (i) Find the survival function of . (ii) Find the hazard rate of . What is the shape of the hazard rate? [2026/10m/1a]
One implementation of the CPU-cache-main memory subsystem of the PDP 11/70 consists of the following chip types:
| Chip type | Number of chips, | Failure rate per chip (number of failures/ hours), |
| SSI | 1,202 | 0·1218 |
| MSI | 668 | 0·242 |
| ROM | 58 | 0·156 |
| RAM | 414 | 0·691 |
| MOS | 256 | 1·0602 |
| BIP | 2,086 | 0·1588 |
It is assumed that the times to failure of all chip types are exponentially distributed with the failure rates shown above. All the chips must be fault-free in order for the system as a whole to be fault-free. (I) Find the system time-to-failure. (II) Find the mean lifetime of the system. (III) What is the probability that the system will still function after 1,000 hours of use? [2026/10m/2a(ii)]
Given a system consisting of components, define the state vector and the structure function of the system. What do they indicate? [2025/5m/2c(i)]
Defining (1) a series system, (2) a parallel system and (3) a -out-of- system, obtain the associated expressions for the structure functions and the reliability functions. [2025/10m/2c(ii)]
Consider a system consisting of three identical units connected in parallel. The unit reliability factor is 0·90. If the unit failures are independent of one another, and if the successful operation of the system depends on the satisfactory performance of any one unit, determine the system’s reliability. [2024/10m/1a]
The reliability function of a cutting assembly is given by: (i) Determine the failure rate. (ii) Does the failure rate increase or decrease with time? (iii) Determine the mean time to failure. [2024/20m/3c]
Consider an item with failure rate . Write down the survivor function and hence evaluate Mean Time To Failure (MTTF). Also obtain the conditional survival function and Mean Residual Life (MRL). [2023/10m/1b]
State the importance of the hazard function. If the hazard rate of a component is given by: then find an expression for the reliability function of the component. [2021/10m/1e]
Define reliability of a system with an example along with the criteria affecting it. [2020/10m/1a]
Define series system and parallel system. In a system, four independently and identically distributed components are connected as per the following configuration. Each component has exponential lifetime with mean equal to 200 hours. Obtain system reliability at time 300 hours:
[Figure: reliability block diagram – the input arrow enters a parallel block of two branches: the upper branch has components and in series, the lower branch has the single component ; the two branches rejoin and the combination is followed in series by component , after which the output arrow leaves.] [2019/10m/1a]
Describe the behaviour of the hazard rate in a bathtub curve. [2018/10m/1d]
Define a series system and a parallel system. Compute the reliability of the following configuration whose components work independently:
[Figure: reliability block diagram – the input arrow passes through component (in series), then enters a parallel block of components (upper branch) and (lower branch); the output of this block is connected in series to a second parallel block of components (upper branch) and (lower branch), after which the output arrow leaves.]
It is given that the components and have component reliabilities 0.6, 0.4, 0.7, 0.8 and 0.5 respectively. [2018/15m/2a]
What is hazard function? Suppose a system has the hazard function given by . Derive the reliability function for the system. What is the name of the underlying distribution function? Name the parameters of the distribution and specify their values for the above system. [2017/10m/1e]
What is a counting process? What are the basic properties of a counting process? Define a renewal process and the renewal function. (ii) If the renewal function is , find the corresponding renewal process. (iii) Suppose are the inter-arrival times of a renewal process . Assume that s are independent and identically distributed with . Find the for and . What are the other possible values of ? [2017/20m/2c(i)]
Suppose that components are connected in parallel. Then such parallel connections are hooked up in series into a single system. If each component has the same reliability, say , for a certain period of operation, assuming independent components, find an expression for the reliability of the entire system. [2016/15m/2b]
Define (i) the reliability function and (ii) the failure rate function of a random variable denoting lifetime of a component. Establish the relation between them, if any. Prove that if is the failure rate function, then . [2015/20m/2c]
Let there be three components with independently and exponentially distributed lifetimes each with mean 1000 hours. Find the mean lifetime of (i) the series system and (ii) the parallel system of these components. [2015/20m/4a]
Define and explain the following terms: (i) Reliability function (ii) Reliability of a series system (iii) Reliability of a parallel system. The mean life of a component is 100 hours. If you want to build a parallel system having a mean life of 200 hours, how many components would be required considering a constant hazard model? [2014/15m/2c]
What are the different methods for determining Reliability? Explain any two of them and also give their merits and demerits. [2013/10m/1b]
Explain the different types of redundancies and their role in improving the reliability of a system. [2011/15m/4c]
Define Reliability. List out some of the problems in achieving reliability. How you will distinguish between Reliability and quality control? [2010/15m/4c]
Explain the difference between Reliability, Maintainability, and Availability. Illustrate your answer by suitable examples. [2007/12m/1c]
Let denote the failure time distribution of the component in a series system consisting of n independent components. Find the system failure time density. [2007/15m/4b]
Explain renewal density and renewal function. [2006/12m/1c]
Describe and illustrate the concepts of (i) reliability and (ii) maintainability. [2006/15m/2b]
Given the hazard function , compute the reliability function & the mean time to failure. [2006/25m/2c]
Define system failure rate. Show that in a series system consisting of n independent components, failure rate is equal to the sum of the failure rates of its components, and it is not true for parallel system. [2005/20m/2b]
Define renewal density and renewal function. Show that the renewal function for an ordinary renewal process is given by [2005/15m/3c]
What is redundancy? Is redundancy at the component level more effective than redundancy at the system level? Justify your answer. [2005/15m/4b]
Explain the concepts of ‘availability’ and ‘maintainability’. [2004/12m/1c]
Explain with examples series and parallel systems. A series system of n components is such that each component has a failure distribution given by [?]. Find the failure distribution of the system assuming that the components operate independently and n is large. What will be this distribution under parallel connection? [2004/20m/2b]
What is redundancy? Explain the use of redundancy in reliability improvement. [2004/15m/4b]
Define (i) a series system, (ii) a parallel system. Let there be three independent components with reliabilities 0.9, 0.8 and 0.7 respectively. What are the reliabilities of the series system, and of the parallel system composed of these components? [2003/20m/2a]
A parallel system is formed of two independent components with exponential life distributions. Show that the hazard rate of the system is not constant. [2003/15m/2b]
Consider a two-component parallel system with a single repairman available for maintenance. Suppose that the failure and repair processes are both Markovian with rates a and b, respectively, Show that the system reliability is where and the Laplace transform of p(t) is P(s). [2002/20m/2c]
Define the terms reliability, maintainability and availability. Also obtain the reliability of an item whose life time distribution is given by [2000/12m/1c]
A system consists of n components and it will function if and only if at least of the n components function. If the life time of the component is exponential with parameter a find the reliability of the system. [2000/12m/2b]
Distinguish between (i) Reliability and Availability (ii) Series and Parallel Systems. [1999/20m/3a]
Explain how the reliability of a system can be increased by utilizing the concept of redundancy. [1999/20m/3b]
A system consists of four identical components connected in parallel. What must be the reliability of each component, if the overall reliability of the system is R? [1999/20m/3c]
Define a renewal process and a renewal function. Also give an example of a renewal process and obtain the associated renewal function. [1999/20m/4a]
Define the terms hazard rate and reliability function with their important properties. Obtain them in the case when the life-time distribution is assumed one-parameter exponential. [1998/20m/7c]
What do you understand by hot and cold use of redundancy in reliability improvement? Discuss. [1998/20m/8c]
The life time of the component of an component system is uniformly distributed over the interval . Find the reliability of the system when the components are connected (i) in series and (ii) in parallel. [1997/20m/7a]
What is a ‘k out of n’ system? Derive an expression for the reliability of such a system in terms of the reliability of the components. [1997/20m/7b]
Explain the main features of a bath tub model failure curve and its suitability in describing real life situations, Illustrate by a suitable example. [1997/20m/8b]
Explain the different types of redundancies and their role in improving the reliability of a system. [1997/20m/8c]
Define a parallel system. Obtain its reliability function and the mean life of the system if all the units are equally reliable and reliability law is exponential. [1996/20m/7a]
Describe a bath-tub failure model and its applications. [1996/20m/7c]
Explain the use of redundancy in reliability improvement. [1996/20m/8a]
Define the terms: (i) Hazard function (ii) IFR and DFR distributions Provide examples. [1996/20m/8b]
Illustrate the concepts of (i) availability, and (ii) maintainability. [1996/20m/8c]
Define the terms (i) Life-time distribution (ii) Reliability of a component (iii) Failure rate (iv) IFR and DFR distributions. [1995/20m/7b]
Compare series and parallel systems, each with n units. [1995/20m/8b]
Examine the use of redundancy in reliability improvement. [1995/20m/8c]
1.4] Failure models and life testing
43 questions
Ten units are tested for 200 hours. Failures occur at 50, 80, 120, and 150 hours (4 failures). Assume that the lifetimes are exponentially distributed with type-I censoring. Find the MLE of , where denotes the failure rate. [2026/5m/4a(ii)]
The lifetime of a semiconductor laser has a log-normal distribution with parameters hours and hours. (i) Find the probability that the lifetime exceeds 10000 hours. (ii) What lifetime is exceeded by 99% of lasers? (Standard normal table is provided.) [2025/10m/1c]
The time to failure for an electronic component used in a flat panel display unit is satisfactorily modelled by a Weibull distribution with the shape parameter and the scale parameter hours. Find the mean time to failure and the fraction of component that is expected to survive beyond 20000 hours. [2025/5m/4c(iii)]
Find the reliability and hazard functions of Weibull distribution with scale parameter and shape parameter , and interpret the findings. [2024/10m/2b]
Suppose that the life in hours of an electric Gadget manufactured by a certain process is normally distributed with parameters hours and some . What would be the maximum allowable value of if the life of the gadget is to have a probability 0.80 of being between 120 hours and 200 hours? (Normal distribution Table is given at the end). [2023/10m/4b(i)]
Let the compressive strength of concrete be log-normally distributed with parameters MPa and MPa where . What is the probability that the strength is less than or equal to 10 MPa? (Normal distribution Table is given at the end) [2023/10m/4b(ii)]
What are the importances of censoring in life-testing experiments? Discuss the estimation of parameters involved in exponential distribution with mean , using type-2 censored sample. [2022/10m/1e]
Define a Weibull distribution with scale parameter and shape parameter . Obtain the hazard function and reliability function of the model. Show also that the distribution satisfies increasing, constant and decreasing failure rate based on suitable choice of the shape parameter. [2022/15m/2b]
A manufacturer finds that on the average, a television set is used 1.8 hours per day. A one year warranty is offered on the picture tube having a mean time to failure (MTTF) of 2000 hours. If the distribution of time to failure is exponential, then determine the percentage of tubes failing during the warranty period. [2021/15m/2a]
Obtain reliability and hazard functions of exponential and lognormal distributions. [2020/15m/2b]
Derive failure rate of a device assuming normal distribution. Suppose the life of an equipment is known to be normally distributed with mean 100 hours and standard deviation 20 hours. What is the probability that the equipment would last at least 130 hours? (Normal Distribution Table is given in Page No. 9) [2020/20m/4c]
Explain the procedure for testing the mean of exponential failure time distribution in the case of failure-censored and time-censored sampling schemes. [2019/20m/3c]
Define failure rate and reliability function of a random variable . Obtain the failure rate and reliability function of the Weibull failure model. State the conditions under which the failure rate is increasing, decreasing and constant. [2018/15m/2b]
Explain left, right and arbitrary censoring in life testing. Cite an example for each of these types. Assuming that the life time follows exponential distribution with failure rate , derive the maximum likelihood estimator for the average life time for the following right censored data: for . [2017/15m/3b]
Differentiate between a censored and a truncated experiment in the context of life testing problems. [2016/10m/1b]
Describe the problem of estimation of the parameter for the exponential density based on type-I and type-II censored data. [2016/15m/4b]
Define (i) Type I censoring, (ii) Type II censoring and (iii) Random censoring. Describe the situations in which they may arise, either by design or due to experimental circumstances. [2015/10m/1b]
Discuss the estimation of the parameter of exponential distribution in case of time censoring. [2014/10m/1c]
Describe Type I and Type II censoring. Discuss the consequence of such censoring in the analysis of lifetime data. [2012/12m/1d]
Project Weibull distribution as a failure model. Derive its hazard function. What is a bathtub curve? [2011/20m/7b]
In a life test with replacement, 35 heaters were put into continuous operation and the first five failures occurred after 250, 380, 610, 980 and 1250 hours. (i) Assuming the exponential model, construct a 95 percent confidence interval for the mean life of this kind of heater. (ii) Test the manufacturer’s claim that the mean life of these heaters is at least 5000 hours at 5% level of significance. Given , , , [2009/12m/1c]
Let be the Weibull failure density function. Given the censored sample corresponding to a total sample of size from Weibull distribution, show that the estimating equations for and are respectively and [2009/25m/3b]
Find the reliability function and failure rate function for the lognormal time-to-failure distribution. [2007/20m/2b]
Explain different types of censoring in life testing experiments. When are these used? [2007/15m/2c]
What are survival models? Explain (i) bath-tub and (ii) Weibull survival models. [2006/15m/4b]
Define failure rate function and obtain it for the Weibull time-to-failure distribution. [2005/12m/1c]
Obtain the maximum likelihood estimate of the mean for the exponential model based on a censored sample. [2005/15m/2c]
Explain the meaning of censored and truncated samples. When are these used? [2004/15m/2c]
Explain the concepts of Type I, Type II and Random censoring. Let T, the lifetime of a unit have exponential distribution with mean . Find the maximum likelihood estimate of and a 95% confidence interval for it in case the data is subject to Type II censoring. [2003/15m/4b]
The failure time distribution of a component is given by: Show that the hazard rate is for all . If the exponential distribution is truncated from above at , then show that the survival distribution function is not exponential but if the truncation is made at from below, it is an exponential distribution. [2002/15m/4b]
Describe Type I, Type II and random censoring of samples. [2001/12m/1c]
Project Weibull distribution as a failure model. Derive its hazard function. What is a bath-tub curve? [2001/20m/2c]
Define the terms reliability, maintainability and availability. Also obtain the reliability of an item whose life time distribution is given by [2000/12m/1c]
Examine Weibull distribution as a failure model. Derive its hazard function,. [1999/20m/4b]
Explain the meaning of censored and truncated samples. When are these used? [1999/20m/4c]
Discuss the role of censored samples in life testing experiments. [1998/20m/7b]
Discuss the estimation of reliability characteristics in Weibull distribution with censored sample. [1998/20m/8a]
Obtain the MLE and UMVUE of the parameter of a one-parameter exponential distribution when first r failure times are recorded. Which of the two will you prefer? [1998/20m/8b]
Show that the Weibull distribution has increasing failure rate when , constant failure rate if and decreasing failure rate if . [1997/20m/7c]
What are type I and type II censored life testing experiments? If the life time distribution is exponential, explain how you will estimate the parameter of the distribution under type II censoring. [1997/20m/8a]
Suggest a procedure for estimating the parameters of a two parameter exponential distribution under type II censoring. [1996/20m/7b]
Examine a Weibull distribution as a failure model. Derive its hazard function. [1995/20m/7c]
In a life testing experiment n identical units are put on test, where the failure time follows an exponential distribution. The life-time of the first r failures is noted. Obtain the ML estimators of (i) mean life-time, and (ii) reliability function. [1995/20m/8a]

Strengthen your GS papers
Our UPSC Mains Topic-wise & Year-wise PYQ eBook (2013–2026) maps every GS question to the syllabus, so you know what UPSC asks and how often.
View the BookDownload Free Sample« Previous: Sampling Theory and Design of Experiments | Next: Optimization Techniques »
Back to: Statistics Optional PYQs – Topic-wise | Also see: Statistics Optional year-wise question papers
Last updated: 31 October 2026