
Here are all 290 Sampling Theory and Design of Experiments questions asked in UPSC Statistics Optional Paper I from 1995 to 2026, arranged under the 10 topics of the official syllabus. Within each topic the latest questions come first.
Each question ends with a code such as [2024/15m/3b] – the year, the marks, the word limit (where UPSC set one) and the question number in the paper.
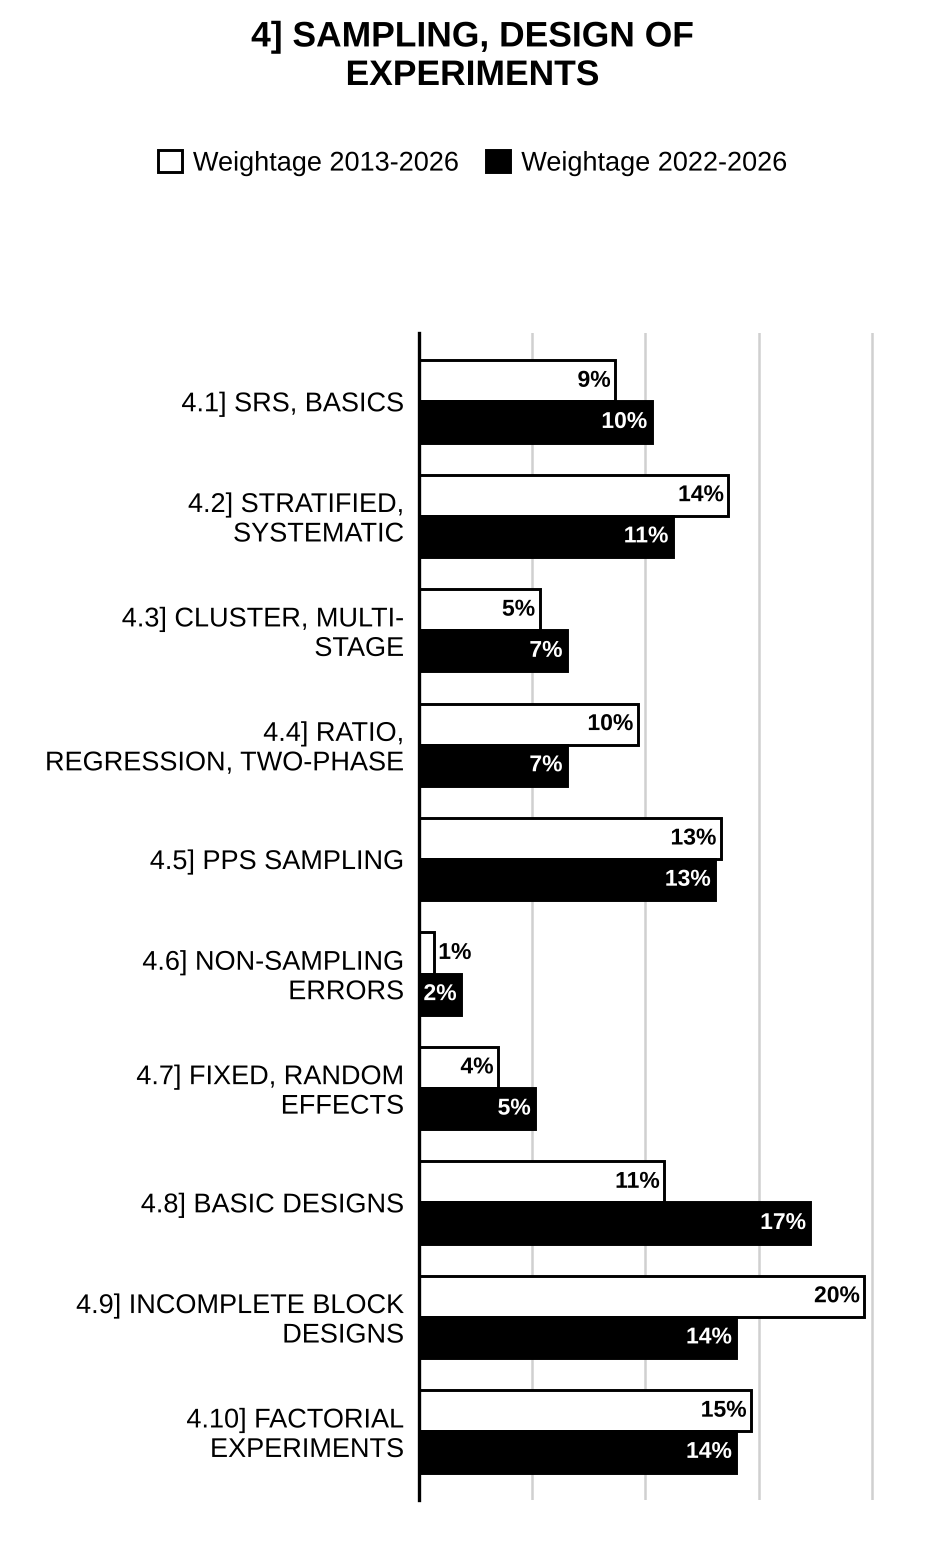
4.1] Basics of sampling and simple random sampling
29 questions
Derive the variance of the sample mean under simple random sample without replacement (SRSWOR). [2026/10m/5d]
Assume that in a population of very large number of items, proportion of defective items is 0·30. What should be the size of the sample, if a simple random sample is to be drawn from this population to estimate the percent defective within 2 percent of the true value with 95·5 percent probability? [Given ; and ]. [2025/10m/5d]
Discuss the difference between sampling for variables and sampling for attributes with examples. For a qualitative characteristic, find an unbiased estimator of population proportion along with its variance when sample is drawn by simple random sampling without replacement. Also obtain an unbiased estimator of this variance. [2023/20m/7a]
A sample of size is drawn with equal probability and without replacement from a population with size . Let be any linear estimate of the population mean , where are constants and denotes the value of the unit included in the sample at the draw. (i) Show that is an unbiased estimate of if and only if (ii) Under above condition (iii) If , for what value of may this variance of the sample mean in simple random sampling without replacement be exactly half the variance of the mean of a random sample of the same size taken with replacement? [2022/15m/7c]
A production unit manufacturing surgical masks is concerned about the quality of their masks. A random sample of masks are inspected to estimate ‘’, the probability of manufacturing a defective mask. How large a sample is required so that the estimate of lies in the range with probability 0.95? [2021/10m/1a]
A sample of size is drawn from a population having units by simple random sampling without replacement. A sub-sample of units is drawn from the units by simple random sampling without replacement. Let denote the mean based on units and , the mean based on units. Consider the estimator of the population mean given by: Show that , and obtain its variance. [2021/10m/5d]
A population consists of 6 units with values 6, 3, 1, 4, 2 and 5. Write down all possible samples of size 2 without replacement and verify that [2020/10m/5c]
In Simple Random Sampling with Replacement (SRSWR) (with usual notation), show that (i) , and (ii) . [2019/10m/5c]
In SRSWOR resulting in unlabelled observations , show that the sample mean is the best linear unbiased estimator of the population mean. [2016/10m/5d]
For a population size 10, show that in SRS without replacement the probability of drawing a specified unit at draw is equal to the probability of drawing it at the first draw. [2014/10m/5c]
Suppose it is required to estimate the average value of output of a group of 5000 factories in a region so that the sample estimate lies within 10% of the true value with confidence coefficient of 95%. The population coefficient of variation is known to be 60%. Determine the equation to calculate minimum sample size. [2013/15m/6c]
Distinguish between simple random sampling with and without replacement. Write down the expression for the number of samples and the probability that a specified individual is included in the sample under both the sampling schemes SRSWR and SRSWOR. [2012/12m/5d]
Let , and the possible distinct samples are , and . If SRSWOR is adopted, write down for . If examine whether is unbiased for the population mean. Also find the expression for , if unbiased. [2012/20m/7a]
6 days are to be selected from the 366 calendar days of 2012 for recording the maximum daily temperature in a metropolitan city. Using the following set of random numbers, select these days, mentioning the month and the date for each, and giving the procedure in detail: 6503 0085 3822 2193 5392 4635 0495 3296 1348. [2011/12m/5c]
Determine the sample size , such that the estimated value, based on this sample, of the mean level in air in 1000 petrol pumps in a large town, differs from the true value by at most with probability 0·95, assuming the standard deviation to be . [2·5% and 5% points of a standard normal variate are 1·960 and 1·645 respectively.]. [2011/20m/6b]
In a population consisting of three units , and , the observations are , and respectively. A sample of size 2 is drawn from the population by using simple random sampling without replacement. Define an estimator as follows: Show that is unbiased estimator of population mean and has smaller variance than sample mean if . [2010/12m/5e]
From a population of units, a random sample of 3 units is drawn by simple random sampling with replacement. Find the expectation of distinct units in the sample. Define as mean of distinct units in the sample. Show that is unbiased estimate of population mean. [2010/20m/6c]
Locate 5 points at random on a rectangular paddy field measuring 30 m × 20 m for conducting a crop-cutting experiment. The points are to be located using rectangular co-ordinates to nearest decimeters with one corner of the plot as origin. The following set of random numbers may be used: 2292 2933 6125 2464 1038 3163 3569 7155 2029 2538 7080 3027 6215 3125 5856 9543. [2009/12m/5c]
In a simple random sample of size 200 (without replacement) from a population of size 1000, 75 persons happened to be smokers. Estimate the proportion of smokers and total number of smokers in the population and calculate 95% confidence interval for the proportion of smokers and also for the total number of smokers in the population. (Given that for 95% confidence probability, ) [2006/12m/5c]
Suppose that coefficient of variation of income of households in a region with 2000 households is 75%. How large a random sample of households is required for a margin of error ± 5% with 95% as [?] confidence coefficient? (For 95% confidence probability, ) [2006/12m/5e]
A simple random sample of size with mean is drawn from a finite population, and a simple random sub-sample of size is drawn from it with mean . Show that (i) . (ii) [2004/12m/5c]
Bring out, giving an example, the relationship between a sampling scheme and a sampling design. [2004/12m/5d]
Show that is an unbiased estimate of the population variance, where for are observed values in SRSWR sampling and is the sample mean. [2001/15m/4i]
Calculate the expectation and the variance of the sample mean in SRSWOR sampling. [2001/15m/6i]
Define first and second order inclusion probabilities. Evaluate them for SRSWR and SRSWOR. [2000/8m/7a(i)]
Suppose one university is interested in determining the attitude of students towards a proposed change in the method of examination in its affiliated colleges and teaching departments. How would you proceed to plan a sample survey for this purpose. [1998/20m/1a]
Suppose of the N units in a population are known to have the value zero and a simple random sample of n units is selected from the non-zero units with replacement. Suggest an unbiased estimator of the overall population mean and obtain its efficiency compared to simple random sampling of n units directly from all the N units with replacement. [1998/20m/1b]
What are the measures of the qualities of an estimator in the case of sampling from finite populations? Explain them. Also show that sampling without replacement is better than sampling with replacement in the case of simple random sampling. [1997/20m/1a]
Define random sampling. Why are random samples distinctly superior to non-random samples? Describe linear systematic sampling with interval k and show that it is an equal probability sampling method. [1996/20m/1a]
4.2] Stratified and systematic sampling
36 questions
A population is divided into three strata. The following data are taken from the population:
| Stratum | |||
| 1 | 200 | 25 | 4 |
| 2 | 300 | 36 | 9 |
| 3 | 500 | 49 | 16 |
Determine the sample size for each stratum for a total sample of size 100 under (i) proportional allocation and (ii) optimum allocation. [2026/10m/5e]
Give an estimate for the population mean under systematic sampling and derive its variance in terms of the intraclass correlation coefficient. [2026/10m/7a(i)]
Discuss the effect of intraclass correlation on the efficiency of this estimator. [2026/5m/7a(ii)]
A very big population is divided into two strata. The allocation of units of stratified random sample of size for the two strata under Neyman allocation are and , and under other type of allocation are and . Define and . Then prove that the efficiency of stratified random sampling with respect to stratified random sampling under Neyman allocation is given by [2024/20m/7a]
The table given below gives the population and sample sizes, stratum means and variance of a stratified random sample of size 50. Symbols used have their usual meanings.
| Stratum Number | ||||
| 1 | 30 | 5 | 35 | 36 |
| 2 | 50 | 10 | 40 | 49 |
| 3 | 60 | 15 | 40 | 81 |
| 4 | 60 | 20 | 55 | 144 |
Verify that the existing allocation is optimum for given 4 strata. Also calculate the estimate of population variance under this allocation. [2023/15m/7b]
In stratified sampling under optimum allocation, how will you proceed to select units from different strata, if one or more ’s happens to be greater than ? [2021/10m/8a(i)]
A sample survey was conducted in a certain district of Himachal Pradesh. Four strata A, B, C and D of villages were formed according to the acreage of fruit trees as obtained from revenue records. A random sample of villages was selected from each stratum and the number of apple orchards in each selected village was noted. The data are shown below:
| Stratum | Total number of villages () | Number of villages in sample () | Number of orchards in the selected villages |
| A (0 – 3 acres) | 275 | 15 | 2, 5, 1, 9, 6, 7, 0, 4, 7, 0, 5, 0, 0, 3, 0 |
| B (3 – 6 acres) | 146 | 10 | 21, 11, 7, 5, 6, 19, 5, 24, 30, 24 |
| C (6 – 15 acres) | 93 | 12 | 3, 10, 4, 11, 38, 11, 4, 46, 4, 18, 1, 39 |
| D (15 acres and above) | 62 | 11 | 30, 42, 20, 38, 29, 22, 31, 28, 66, 14, 15 |
Estimate the number of orchards in the district. [2021/10m/8a(ii)]
What is systematic sampling? In usual notation, prove that where is the intra-class correlation coefficient between the units of the same systematic samples. Hence, determine the minimum value of for to be non-negative. [2020/20m/6a]
For a population with linear trend and ( = population size, = sample size, = sampling interval) show that where , and are respectively for sampling variances of the sample unbiased estimator of the population mean for stratified sampling, systematic sampling and SRSWOR. [2019/15m/8a]
Explain stratified random sampling and give reasons for its preference to simple random sampling. With two strata, a sampler would like to have for administrative convenience instead of using the values given by the Neyman allocation. If and denote the variances given by the and Neyman allocations respectively, show that the fractional increase in the variance is where as given by Neyman allocation. [2018/20m/8a]
Explain the method of systematic sampling and give its merits and demerits. How do you estimate the sampling variance of the estimate of the population total? Show how systematic sampling is a particular case of cluster sampling. [2017/20m/7a]
Show that where and are respectively the variances of the estimated means under simple random sampling and stratified random sampling with proportional allocation. All other notations have their usual interpretations. [2015/10m/5d]
200 boys and 100 girls of a college appeared in an examination. Means and variances of their scores are as given below:
| Category | No. of Students | Mean Marks | Variance |
| Boys | 200 | 40 | 10 |
| Girls | 100 | 50 | 20 |
How will you draw a random sample of size 30 using proportional allocation? Hence obtain the variance of the estimator of the population mean. [2014/15m/8b]
Show that systematic sample is better than SRSWOR if where and are sample and population sizes respectively and is the intraclass correlation between pairs of units that are in the same systematic sample. [2013/10m/5c]
A rural block in a district was divided into 3 strata. The following table gives the number of villages and standard deviation of area under wheat crop for different strata:
| Stratum No. | No. of villages | Standard deviation |
| 1 | 15 | 100 |
| 2 | 10 | 50 |
| 3 | 25 | 120 |
A sample of 20 villages is to be drawn. How many villages should be selected from each strata under (i) proportional allocation? (ii) Neyman allocation? [2013/15m/7c]
If , and respectively denote the variance of the estimator of the population mean under SRSWOR, stratified sampling under proportional allocation and Neyman allocation, show that [2012/20m/8b]
The variable under study has rectangular distribution in the interval . The interval is divided into equal subintervals which form strata of equal sizes. From each stratum, a simple random sample of units is drawn. Let and be the variances of estimator of population mean based on stratified and unstratified samples of size respectively. Prove that . [2010/20m/7b]
A committee of 5 is to be formed from amongst 86 officers, numbered serially from 1 to 86. Draw a circular systematic sample for this purpose, giving the procedure you have followed in detail. You may use the following set of random numbers: 1349 0417 9311 9787 1284 0769 8422 1077. [2009/12m/5a]
A rural block in a district was divided into 3 strata. The following table gives some relevant information:
| Stratum No. | Number of Villages | Area under wheat (hectares) | S.D. (hectares) |
| 1 | 20 | 620 | 100·5 |
| 2 | 15 | 580 | 90·8 |
| 3 | 25 | 825 | 140·7 |
A sample of 10 villages is to be drawn. How many villages should be selected from different strata using (i) proportional allocation, (ii) optimum allocation, and (iii) allocation proportional to area under crop? [2009/20m/7b]
Assume that the population size is an integral multiple of the sample size. Compare the efficiencies of the sample mean based on stratified random sample with one unit per stratum and systematic sample when there is a linear trend in the population. [2007/20m/7b]
In a stratified population with two strata, the values of , and are as follows:
| 1 | 0.35 | 15 | 4 |
| 2 | 0.65 | 25 | 8 |
If the cost function is of the form , find the values of and that minimize C for a given value of , where the symbols have their usual meanings. Also find the sample sizes and for , ignoring f.p.c. [2006/20m/7b]
Discuss how one can unbiasedly estimate the population variance using stratified simple random sampling. [2005/20m/7a]
If finite population correction is ignored, then show that where , and denote variance of optimum allocation, allocation, proportional allocation and simple random sample respectively. [2003/20m/7a]
Prove that the variance of the mean of systematic sample is where and is the intraclass correlation coefficient between the units of the same systematic sample. [2003/20m/7b]
Describe any two methods of improving the performance of systematic sampling in the presence of a linear trend. [2002/20m/7b]
Match X with Y.
| X | Y |
| (i) Replication | (a) Stratified sampling |
| (ii) Neyman allocation | (b) Analysis of variance |
| (iii) Variance covariance matrix | (c) Design of experiment |
| (iv) One-way classification | (d) Multivariate analysis |
[2001/12m/5b]
Give your critical comments on the following observation “A great disadvantage of systematic sampling is that the variance of the estimated mean does not necessarily decrease as the sample size is increased.” [2001/15m/7iii]
Discuss the advantages of stratified sampling in comparison to unstratified sampling. [2000/12m/5d]
Explain proportional and optimum (Neyman) allocations in the context of stratified sampling. [1999/15m/16a]
Suppose a stratified sampling design is adopted for estimating the overall proportion P of units having a specified characteristic by dividing the population of units into K strata and selecting n units from units in the stratum , with equal probability and without replacement. Suggest an unbiased estimator of P and obtain its sampling variance. [1998/20m/1c]
In the case of stratified random sampling, assuming a simple linear cost function, obtain the optimal strata sample sizes which minimize the variance of the unbiased estimator of the population proportion when the total cost is fixed. Also obtain the expression for the total sample size. [1997/20m/1c]
In the context of estimating a population percentage, show that if the population has a linear trend, where V stands for the variance of the unbiased estimator of the population percentage and st, sy and sr respectively stand for stratified random, systematic and simple random sampling. [1997/20m/2b]
Define random sampling. Why are random samples distinctly superior to non-random samples? Describe linear systematic sampling with interval k and show that it is an equal probability sampling method. [1996/20m/1a]
State the common reasons for stratifying a population before sampling. [1996/20m/1c]
Define linear and circular systematic sampling. Under linear systematic sampling and with the usual notation, show that where is the correlation coefficient between pairs of units that are in the same systematic sample. [1995/20m/1c]
State the principles for (i) stratifying a finite population, (ii) forming clusters of elements. Explain why these are diametrically opposite. [1995/20m/2a]
4.3] Cluster and multi-stage sampling
15 questions
A bank has 40000 clients in its computer files, divided into 4000 branches, each managing exactly 10 clients. To estimate the proportion of clients for whom the bank has granted loan, a simple random sample of 40 branches is selected. From the selected sample, for each branch , a list of clients having a loan is prepared; . The data observed from the selected sample are What type of sampling is this? [2024/3m/7b(i)]
State the expression of the parameter to estimate and obtain its unbiased estimate. [2024/6m/7b(ii)]
Estimate the variance of the unbiased estimator obtained in part (ii). [2024/6m/7b(iii)]
Describe with examples the technique of two-stage sampling. Obtain the variance of the sample mean under two-stage sampling without replacement. Hence, deduce the variance of the sample mean under: (i) Stratified random sampling, and (ii) Cluster sampling. [2022/20m/6b]
In cluster sampling with equal size clusters, obtain the unbiased estimate of population mean. Also obtain its sampling variance as where notations have their usual meanings. [2021/15m/6b]
A simple random sample of clusters, each containing elements, is drawn from the clusters of the population and the clusters sampled are enumerated completely. Suggest an unbiased estimator of the population mean per element and derive the expression for the variance of the proposed estimator in terms of the population intraclass correlation coefficient. [2015/15m/8c]
Consider the area under wheat for a sample of 44 clusters selected from 11 different villages. Four clusters were selected from each of the 11 villages and each cluster consists of 8 consecutive survey numbers (fields). Here sum of squares (SS) due to between villages is 2000, SS due to between clusters within villages is 8250 and Total SS is 30000. Write the ANOVA table. [2014/15m/6b]
In a planned town, there are blocks each containing residential buildings. A simple random sample of blocks is drawn, and the numbers of working women in all the residential buildings belonging to these selected blocks are counted. Based on these figures, suggest an unbiased (to be shown) estimator of the total number of working women in the town, and derive the standard error of the estimator. [2011/20m/8c]
You are to estimate the proportion of school-going students (Classes V to XII) using mobile phones in a metropolitan city. Suggest a two-stage sampling scheme. Using a suitable notation, give the estimator to be used, and check if the estimator is unbiased. [2009/20m/8a]
Define cluster sampling. Write the basic difference between the cluster sampling and stratified sampling. [2003/12m/5d]
(i) Define two-stage sampling. (ii) Describe the use of critical differences in comparison of pair-wise differences amongst treatment effects. (iii) If regression coefficient of y on x is and regression coefficient of x on y is , find the value of correlation coefficient. (iv) Explain the concept of confounding in factorial experiments. [2001/12m/5e]
Suppose a population consists of N first stage units (fsu) each of which contains M second-stage units (ssu). An SRSWOR of size n is taken from the N fsu and then from each selected fsu m ssu are selected at random without replacement. On the basis of the mn ssu suggest an unbiased estimator for the population mean. Find its variance. How will you determine a and m for a cost function , where c = total cost, a = overhead cost, = cost per fsu, = cost per ssu, with minimum variance. [2000/20m/7c]
Describe two-stage sampling. How would you estimate the population mean and obtain its variance, using a two-stage sample if all primary units have equal number of secondary units? [1999/30m/15b]
Distinguish between two phase and two stage sampling. For the case of two stage sampling with equal sized first stage units, obtain an unbiased estimator of the population mean and find its variance. Also estimate this variance unbiasedly. [1997/20m/2a]
State the principles for (i) stratifying a finite population, (ii) forming clusters of elements. Explain why these are diametrically opposite. [1995/20m/2a]
4.4] Ratio and regression estimation; Two-phase sampling
32 questions
To estimate the population mean of a characteristic , a simple random sample of size 1000 was selected from a population of size 1000000 by without replacement. The population mean of an auxiliary character is . The other results are given below: Estimate using difference, ratio and regression estimators. [2024/6m/8b(i)]
Estimate the MSE of these estimators. Which estimator should we choose to estimate ? [2024/9m/8b(ii)]
Define regression estimator used for the estimation of population mean. Obtain its bias and Mean Square Error (MSE) to the first order of approximation. [2023/10m/5e]
If the coefficients of variation of and are equal and the correlation coefficient between and is , compute the efficiency of ratio estimator relative to the mean of a simple random sample. [2022/10m/5e]
Define Regression estimator. Show bias . Under what conditions is bias negligible? Find the mean square error of the estimator to first degree of approximation. Give comparison of Regression estimator with Ratio estimator. [2021/15m/7c]
Let be the ratio of population totals of ‘’ and ‘’ and is the estimate of . Obtain . Also find the estimate . [2020/15m/7b]
With usual notation, show that the ratio estimator is the best linear unbiased estimator of mentioning the conditions under which the property holds. [2019/10m/5d]
Show that the approximate variance of the regression estimator is (with usual notation). [2019/15m/6a]
Compare ratio and regression methods of estimation. Show that ratio method gives a biased estimation of population total. Derive an approximate expression of the bias. [2018/15m/6c]
Two dentists A and B make a survey of the state of the teeth of 200 children in a village. Dr. A selects a simple random sample of 20 children and counts the number of decayed teeth for each child with the following results:
| No. of decayed teeth | 0 | 1 | 2 | 3 | 4 | 5 | 6 | 7 | 8 | 9 | 10 |
| No. of children | 8 | 4 | 2 | 2 | 1 | 1 | 0 | 0 | 0 | 1 | 1 |
Dr. B using the same dental technique, examines all 200 children, recording merely those who have no decayed teeth. He finds 60 children with no decayed teeth. Estimate the total number of decayed teeth using (i) Dr. A’s results only (ii) Both Dr. A’s and Dr. B’s results Which estimate do you prefer and why? [2018/15m/7c]
An investigator selects 10 one-acre plots by simple random sampling and counts the number of trees on each plot. She also has aerial photographs of the plantation from which she can estimate the number of trees on each plot of the entire plantation. Hence, she knows and since the two counts are approximately proportional through the origin, she uses a ratio estimate to estimate . The data yield the following: (plantation size), (taken by SRS) = The actual count of trees in one-acre plots, = The aerial estimate for each plot ,
| Plot | 1 | 2 | 3 | 4 | 5 | 6 | 7 | 8 | 9 | 10 |
| Actual No. per acre | 25 | 15 | 22 | 24 | 13 | 18 | 35 | 30 | 10 | 29 |
| Aerial estimate | 23 | 14 | 20 | 25 | 12 | 18 | 30 | 27 | 8 | 31 |
Estimate the average number of trees per acre and the standard error of the estimate. [2017/10m/5d]
Define a ratio estimator. Show that it is biased. Suggest a suitable sampling procedure for which the classical ratio estimator of a population ratio is unbiased. For the suggested procedure, propose an unbiased estimator of the variance of the ratio estimator. [2013/15m/8c]
The total population size of a district in 2001 census is available. The population sizes of a random sample of villages from the district individually in both 2001 and 2011 censuses are also available. Suggest a suitable estimator of the total population of the district in 2011, based on these figures using the ratio method of estimation. Derive an expression for the bias of the estimator and deduce the condition under which the bias is negligible. [2011/20m/7b]
Define ratio estimator for estimating the population total and derive expression for the standard error of the estimator. [2010/20m/8a]
Define the regression estimator of a finite population mean and work out its approximate mean square error, assuming that the second sample is a sub-sample of the first sample. [2007/20m/7c]
Define ratio estimator. In srswor (N, n), show that the mse of is approximately given by (Retaining only the first term in an expansion) [2006/20m/7a]
In double sampling for stratification, if the first sample is random (of size ), the second sample is a stratified random subsample of the first of size , where , and are fixed, then show that Where is the population variance and other notations have their usual meanings. [2006/20m/7c]
Show that the usual regression estimator is unbiased under a suitable model to be specified by you. Also, obtain the model variance of this estimator. [2004/20m/7b]
Define regression estimator. When it becomes consistent? Write the reasons for becoming regression estimator biased. [2003/12m/5c]
Explain the concept of ratio estimator. Prove that in large sample, with simple random sampling, the ratio estimate has a smaller variance than the population estimate obtained by simple expansion, if [2003/20m/7c]
If is the ratio estimator of the population mean , then prove that where is the coefficient of variation of the sample mean . [2002/12m/5d]
(i) Write down an approximation for the variance of the usual estimate of the ratio of the means of two correlated variables, in the case of SRSWR sampling. (ii) Write down the variance of the Horvitz-Thomson unbiased estimate of the population total. (iii) Write the linear statistical model for the analysis of Randomized Block Design. (iv) Write down the partial correlation coefficient between the first and second variables, eliminating the effect of the third variable from each of them, in terms of the three pair-wise total correlation coefficients. [2001/12m/5d]
Define a ratio estimator for population mean on the basis of a sample of size n selected with SRSWOR. Derive the expressions for its bias and mean square error in large sample. [2000/12m/7a(ii)]
Discuss ratio and regression methods of estimation and compare them. [1999/30m/15a]
Explain the ratio method of estimation. Derive the conditions, if any, under which a ratio estimator of the population mean using the information on an auxiliary variable X, is more efficient than the sample mean in the case of simple random sampling without replacement, stating clearly the assumptions involved. [1998/20m/2a]
Indicating what is a regression estimator, state under what circumstances you would use this estimator in preference to a ratio estimator. [1998/20m/2b]
With an example explain ratio estimator. In the case of simple random sampling without replacement obtain an expression for the bias of the ratio estimator of the population mean. [1997/20m/2c]
Outline the ratio and regression methods of estimating a population total. When and how are these methods useful? [1996/20m/2a]
Explain the use of double sampling for stratification. [1996/20m/2b]
Give one illustration each for use of auxiliary information in sample surveys for (i) selection of sample units, and (ii) construction of an estimator of a population total. [1995/20m/1b]
Outline the regression method of estimation. Obtain the large sample variance of the regression estimator of the population mean in simple random sampling. [1995/20m/2b]
When and how is double sampling useful? [1995/20m/2c]
4.5] PPS sampling
34 questions
A population of units has values , , and . Consider a sample of size without replacement with inclusion probabilities proportional to a size measure , where , , , . The inclusion probabilities are taken as (i) Suppose the selected sample is . Using Horvitz-Thompson estimator, estimate the population total. (ii) Given the joint inclusion probabilities for units 2 and 4, estimate the variance of Horvitz-Thompson estimator and comment on the possibility of negative variance estimate. [2026/15m/8b]
Define Horvitz-Thompson estimator for estimating the population total, and show that it is unbiased for probability proportional to size sampling without replacement. Also find its sampling variance. [2025/15m/7c]
For the population , consider the following sampling design: Calculate the first-order and second-order inclusion probabilities. Hence show that it is a matter of a stratified design. Identify the strata with their units. [2024/10m/5d]
Differentiate between Simple Random Sampling and Probability Proportional to Size Sampling. How will you draw a PPS sample of size from a population of size by (i) Cumulative Total Method and (ii) Lahri’s Method? Explain. [2023/15m/7c]
Consider an artificial population of three farms. Their selection probabilities and the wheat production (in ’000 tons) are as follows:
| Farm unit (i) | 1 | 2 | 3 |
| Selection probability () | 0.3 | 0.2 | 0.5 |
| Wheat production () | 11 | 6 | 25 |
Draw all possible samples of size 2 with replacement (order is to be considered). Show that Horvitz-Thompson estimator of total wheat production is unbiased. [2022/15m/8b]
Show that in pps sampling, with replacement, an unbiased estimator of the population mean is with variance where be the probability that the unit is selected in a sample, such that , . [2020/15m/8b]
Mentioning clearly about the notations, show that Horvitz-Thompson estimator of the population total is an unbiased estimator of and variance is [2019/15m/7b]
A population has seven units consisting of 30, 10, 25, 5, 20, 6 and 4 fields. Select a PPS sample of units of size 3, using random numbers 72, 46 and 94. [2018/10m/5d]
Derive the expression for the variance of Horvitz-Thompson estimator (HTE) of population total. Point out the difficulty faced in estimating it. Find Yates-Grundy variance estimator. [2017/15m/8c]
Let be the finite population of size . Let , , and be the samples with probabilities , . Find the first- and second-order inclusion probabilities. [2016/20m/6a]
Let be a finite population of size 6. Let be the support of the design. Let Obtain the Horvitz-Thompson estimates (HTE) and hence show that HTE is an unbiased estimator of the population total. [2016/15m/7c]
For an arbitrary fixed effective size sampling design with positive second order inclusion probabilities, derive the Yates-Grundy form of the variance of the Horvitz-Thompson estimator of a finite population total and hence obtain the Yates-Grundy unbiased estimator of this variance. [2015/20m/6a]
Explain Horvitz-Thomson estimator of the population mean. Show that H-T estimator is unbiased estimator of population mean. Also obtain its variance. [2014/20m/7a]
What are inclusion probabilities? Use this concept to define the Horvitz-Thomson estimator. If and denote the first and second order inclusion probabilities under an arbitary ordered design of fixed size, show that (i) and (ii) where is the expected effective sample size. [2012/20m/8a]
Consider a population of 3 units , and . The size measures of , and are respectively , and . A sample of two units is drawn from the population without replacement such that the first unit is selected with probability proportional to their sizes and second unit is selected with probability proportional to the sizes of the remaining units. If denotes the probability of inclusion of in the sample, show that [2010/12m/5a]
For pps sampling without replacement, give the Horvitz-Thompson estimator of the population total. Show that it is unbiased. Also obtain its variance. [2009/12m/5d]
Describe Horvitz-Thompson estimator of a finite population total and give an estimate of its standard error. [2007/12m/5f]
Consider PPS sampling without replacement, based on positive size measures. Define the Des Raj estimator of the population total and prove its unbiasedness. [2007/20m/7a]
Explain Lahiri’s method for selection of a PPS sample. [2005/12m/5d]
Let and denote respectively the inclusion probability of population unit i and the joint inclusion probability of two distinct units i and j in a PPSWOR sample of size 2. Express and in terms of selection probabilities and verify that and that where N is the population size. [2005/20m/7b]
Describe a method of selecting a sample with probability proportional to size and with replacement. [2004/10m/7a(i)]
Obtain the variance and its estimator for the Hansen-Hurwitz estimator. [2004/10m/7a(ii)]
Let be the probability of not including the i th unit in the sample and let be the probability of including neither the i th nor the j th units in the sample. Then, show that where is the probability of including the i th unit in the sample and is the probability of including both the i th and the j th units in the sample. [2002/12m/5c]
Describe Lahiri’s method of selecting a sample with probability proportional to size and with replacement. For this method, show that the average number of draws to select one unit is where M is the maximum of sizes and . [2002/20m/7a]
Obtain the necessary form of a non-negative unbiased estimator of the variance of the Horvitz-Thompson estimator. [2002/20m/7c]
(i) Write down an approximation for the variance of the usual estimate of the ratio of the means of two correlated variables, in the case of SRSWR sampling. (ii) Write down the variance of the Horvitz-Thomson unbiased estimate of the population total. (iii) Write the linear statistical model for the analysis of Randomized Block Design. (iv) Write down the partial correlation coefficient between the first and second variables, eliminating the effect of the third variable from each of them, in terms of the three pair-wise total correlation coefficients. [2001/12m/5d]
Define the Horvitz-Thompson estimator of the population total based on a sample of n distinct units from a finite population of N units with given positive inclusion probabilities of first and second orders. Show that the estimator is unbiased and derive the expression for its variance. [2000/12m/5c]
Describe a method for selection of n units from a finite population with (1) PPSWR and (2) PPSWOR. [2000/10m/7b(i)]
Define Hansen-Hurwitz Estimator (HHE) for the population mean and obtain its variance. [2000/10m/7b(ii)]
Consider p.p.s. sampling (without replacement) of two units based on positive size measure. Show that the Yates–Grundy estimator of the variance of the Horvitz-Thompson estimator of the population total is always non-negative. [1999/30m/16c]
Explain clearly the concept of PPS sampling. What are its advantages and disadvantages? [1998/20m/2c]
What is probability proportional to size (PPS) sampling? In what situations is PPS sampling recommended? Also explain a method of selecting a PPS sample without replacement. Further obtain an unbiased estimator of the population mean and the variance of this estimator using a PPS sample. [1997/20m/1b]
State the Horvitz-Thompson estimator of a population total in PPS sampling without replacement. Show that it is unbiased. [1996/20m/1b]
Give one illustration each for use of auxiliary information in sample surveys for (i) selection of sample units, and (ii) construction of an estimator of a population total. [1995/20m/1b]

Preparing for Prelims too?
Our UPSC Prelims Topic-wise PYQ eBook covers every Prelims question with detailed explanations, so you can see exactly where UPSC asks from.
View the BookDownload Free Sample4.6] Non-sampling errors
5 questions
Distinguish between Sampling and Non-sampling Errors. What are their sources? How these errors can be controlled? [2025/10m/8c]
Briefly explain the idea behind Randomized Response Technique and indicate its possible uses. [2005/20m/7c]
Using Warner’s randomized response technique, obtain the estimate of the population proportion relating to the sensitive characteristic. [2004/20m/7c]
Write a note on Randomised Response Technique, indicating situations where to use it. [1999/15m/16b]
Write a brief note on “non-sampling errors”. [1996/20m/2c]
4.7] Fixed, random and mixed effects models
12 questions
The following data come from a two-factor random effect model:
| Factor A \ Factor B | |||
| 6, 8 | 10, 12 | 14, 16 | |
| 12, 14 | 16, 18 | 20, 22 |
(i) Given that the experimentor suspects interaction, write the linear model stating all the assumptions for the above data. (ii) Clearly stating the hypothesis, carry out the tests for the main effects and interactions giving the complete ANOVA table for the above data. [2026/20m/7b]
Differentiate among fixed, random and mixed effect models with examples. How are the three basic principles of design fulfilled in randomised block design? Explain. [2023/15m/8c]
Distinguish between fixed effect model, random effect model and mixed effect model. [2019/15m/6b]
For a balanced one-way random effects model where and , show that where . [2017/10m/5c]
The levels of a factor are the only levels the experimenter is interested in, while the levels of the factor chosen form a random sample from the totality of levels available. Only one observation per cell , , , is taken on the response variable. Write down the appropriate linear model, the hypotheses to be tested, the test statistics and the level- critical regions. [2011/12m/5a]
Write down the random effects model for a set of two-way classified data with one observation per cell, stating the underlying assumptions completely. What are the hypotheses that can be tested using the ANOVA technique? Give the ANOVA table with explicit expressions for the different sums of squares, and the test statistics for the above hypotheses. [2009/20m/8b]
With reference to a completely balanced two-way random effects model, find unbiased estimators of the different variance components. [2007/12m/5c]
What are ‘mixed effects’ models? Indicate the analysis of two-way classified data with equal number of observations per cell, using a mixed-effects model. [2005/20m/8c]
Derive the analysis of variance table for 2-way classification with m (> 1) observations per cell in the case of a random effects model. [2004/20m/8b]
Interpret the Analysis of Variance Table in two-way mixed effects model with equal number of observations in each cell. [2001/15m/6iv]
Explain Fixed Effect and Mixed Effect models in two-way classification with examples. [2001/15m/8i]
When is a two-way ANOVA model said to be mixed? How will you formulate the different hypotheses of this model? Describe how the hypotheses are tested. [2000/20m/8a]
4.8] Basic designs
42 questions
How do the size and shape of plots and blocks effect the results of field experiments? [2025/10m/5e]
Analyse and interpret the following data concerning output of wheat per field obtained as a result of experiment conducted to test four varieties of wheat , , and under a Latin square design at 5% level of significance. [Given ; ].
| C 35 | B 33 | A 30 | D 30 |
| A 29 | D 29 | C 31 | B 28 |
| B 29 | A 24 | D 27 | C 30 |
| D 27 | C 30 | B 31 | A 25 |
[2025/20m/7a]
For the given data, the yield of the treatment in the second block is missing and is denoted as ‘’. Estimate the missing value, and analyse the data by assuming the level of significance = 0·05.
| Treatments | Block I | Block II | Block III |
| A | 22 | 24 | 22 |
| B | 20 | 18 | |
| C | 21 | 25 | 20 |
[Given that ; and ] [2025/20m/8b]
Complete the following analysis of variance table of a design and examine whether there is a significant difference between the treatments at 5% level of significance:
| Source of Variation | Degrees of Freedom | Sum of Squares | Mean Sum of Squares | Variance Ratio |
| Blocks | – | 21 | 4.2 | – |
| Treatments | – | – | 5.0 | – |
| Error | 15 | 12 | – | |
| Total | – | – |
Given that , [2023/10m/5d]
Differentiate among fixed, random and mixed effect models with examples. How are the three basic principles of design fulfilled in randomised block design? Explain. [2023/15m/8c]
What is a uniformity trial? Explain how it can be used to determine optimum shape and size. [2022/10m/5c]
What is a missing plot technique? Derive the missing value formula for a Latin Square Design. How would you proceed to analyse such a design? [2022/15m/8c]
How is the efficiency of a design measured? Derive the expression to measure the efficiency of a Randomised Block Design over a Completely Randomised Design. [2021/10m/5e]
Explain Duncan’s Multiple Range Test. [2019/10m/5e]
Grain yields per plant (grams) of paddy of nine varieties in a Randomised Block Design are presented below:
| Variety | Replication 1 | Replication 2 | Replication 3 |
| 1 | 21.0 | 20.0 | 19.5 |
| 2 | 19 | 18 | 18.5 |
| 3 | 18.5 | 18 | 18.9 |
| 4 | 27.5 | * | 27 |
| 5 | 31 | 32.5 | 32.6 |
| 6 | 31.5 | 30.5 | 32 |
| 7 | 25.3 | 25 | 26.6 |
| 8 | 39 | 40 | 38.5 |
| 9 | 39 | 38.5 | 40 |
Analyse the experimental data. (Table value and , at 5% level of significance) [2019/20m/8c]
In a randomized block design with treatments and replicates, one observation was found missing. Explain the method of estimating the missing value and perform the analysis of variance. [2018/10m/5e]
Define orthogonal design. Show that randomised block design is an orthogonal design. [2016/10m/5c]
Consider a RBD with 4 treatments arranged in 5 blocks. Show that RBD is orthogonal. [2014/10m/5d]
Explain in detail, the procedure of randomization (i.e., allocation of treatments randomly to plots) followed in randomized block design and Latin square design. [2010/12m/5f]
In a randomized block design with treatments and replications, two observations are missing. One missing observation is related to th treatment in th block and the other is related to th treatment in th block and . How will you estimate the missing observations? Derive the expressions for the estimate of missing observations. [2010/20m/7c]
Use the following set of random numbers to obtain the lay-out of a randomised block design with 5 treatments and 4 blocks, giving the outline of the procedure you have followed: 5711 7343 7539 3684 9397 5335 4031 1486 2588 3301 0553 2427 3598 2580 7017 9176. [2009/20m/6c]
Compare completely Randomised Design, Randomised Block Design and Latin Square Design in terms of flexibility for number of treatments and number of replicates per treatment on the one hand, and error-control on the other. [2009/20m/8c]
In a Latin Square design, two observations from the same row are missing. Derive the analysis of the design. [2007/20m/8b]
What is a Latin square design? Give the analysis of an m × m Latin square design, with one missing value. [2006/12m/5f]
Give the analysis of an LSD if the yield of one of the plots is missing. [2004/20m/8a]
Give the layout of a randomized block design considering 6 treatments into 5 blocks. Whether this is a balanced design? Give the complete analysis of variance of randomized block design with k treatments and r blocks. (Derivation of formulae not needed). [2003/20m/8b]
Explain the missing plot technique. In an experiment arranged in the form of a randomized block design, the yield of a single plot is ruined by pests. Indicate, giving theory, as to how you will analyze the experiment. [2002/20m/8b]
Choose the most appropriate answer: (i) The main reason for forming blocks in experimental designs is ……….. (error control, replication, increasing inductive scope) (ii) The correlation coefficient of y on x is 0.5. This means the proportion of the variability in p accounted for by x is …………….(75%, 50%, 25%) (iii) In a design, the main effects are confounded with the block effects. (Split Plot, Latin Square Randomized Blocks) (iv) In a sample of size n, drawn from a population of size N, drawn by the method of simple random sampling without replacement, the probability that a particular unit is included is ……………… [2001/12m/5a]
Match X with Y.
| X | Y |
| (i) Replication | (a) Stratified sampling |
| (ii) Neyman allocation | (b) Analysis of variance |
| (iii) Variance covariance matrix | (c) Design of experiment |
| (iv) One-way classification | (d) Multivariate analysis |
[2001/12m/5b]
Fill up the blanks in parts (i), (ii) and (iii) and answer (iv). (i) The arithmetic mean of a positive valued statistical variable is than the reciprocal of the arithmetic mean of the reciprocal of the variable. (ii) If one observation is missing in a Randomized Block Design with v treatments and b blocks, in the Analysis of Variance Table, the number of degrees of freedom for treatments will be and that for error will be (iii) The Gauss-Markov Theorem requires the error components to have mean values, variance and all pair-wise covariance’s to be (iv) Write down the structure of the Analysis of Variance Table for a Latin Square Design of order m. [2001/12m/5c]
(i) Define two-stage sampling. (ii) Describe the use of critical differences in comparison of pair-wise differences amongst treatment effects. (iii) If regression coefficient of y on x is and regression coefficient of x on y is , find the value of correlation coefficient. (iv) Explain the concept of confounding in factorial experiments. [2001/12m/5e]
Construct a Latin Square Design of order 5. [2001/15m/6ii]
Explain how the basic principles of randomization, replication and error control are utilized in a Randomized Blocks Design. [2001/15m/7i]
What is the difficulty in analyzing a Latin Square Design of size 2? [2001/15m/7ii]
What is missing plot technique? Describe, in detail, the analysis of a RBD with one missing observation. How will the analysis be modified if there are more than one missing observations? [2000/12m/5e]
Distinguish between elementary contrasts and orthogonal contrasts in the context of a set of v treatments. [2000/6m/8b(i)]
What is missing plot technique? Explain its importance. In a randomized block design one observation is missing. Estimate the missing value and indicate how you will carry out the exact analysis. [1999/30m/14a]
Explain uniformity trials. Discuss their use in picking up a proper design. [1998/15m/3a]
Explain Fisher’s missing plot technique and indicate how you will carry out the exact analysis of variance for a randomized block design with one missing observation. [1998/30m/3b]
Explain the need for and the benefits due to the use of randomisation, replication and local control techniques in designing statistical experiments. [1997/20m/3a]
Explaining the rationale behind the missing plot technique, derive the formula for estimating a single missing value in a Latin square design. In such a situation explain how you will test for (i) the equality of the treatment means and (ii) the difference between two treatment means one of which relates to the missing value. [1997/20m/3b]
State the basic principles of designed experiments and their role in such experiments. [1996/20m/3a]
Give the linear model and outline the method of analysis of a RBD. [1996/20m/3b]
Analyze completely the following data from an experiment which used a Latin Square design.
| Order of assembly | Operator I | Operator II | Operator III | Operator IV |
| 1 | 10 C | 14 D | 7 A | 8 B |
| 2 | 7 B | 18 C | 11 D | 8 A |
| 3 | 5 A | 10 B | 11 C | 9 D |
| 4 | 10 D | 10 A | 12 B | 14 C |
The letters A, B, C and D represent four assembly methods. The relevant table value of F for is 4.76. [1996/20m/4a]
Explain the role of randomization in designed experiments. Describe an RBD in this context. [1995/20m/3a]
Obtain an estimate of a missing observation in a Latin Square Design. How does the subsequent analysis differ from the usual case? [1995/20m/3b]
Write a short note on multiple comparison methods. [1995/20m/4c]
4.9] Incomplete block designs
39 questions
A balanced incomplete block design (BIBD) has parameters (treatments), (blocks), (replicates per treatment), (block size), . The following adjusted treatment totals (after removing block effects) are given as , , and . The MSE is given as 2·5. (i) Verify if this is a valid BIBD. (ii) Estimate the treatment effects and their variances. (iii) Compute the efficiency factor of this BIBD relative to a randomized complete block design with the same number of replications. [2026/15m/7c]
Let the incidence matrix of a design be Show that– (i) the design is connected balanced; (ii) its efficiency factor is . [2024/10m/5e]
Verify whether the following BIBD are possible: (1) (2) Given that the design is resolvable. [2024/8m/7c(i)]
Given below is the incidence matrix of a block design. Find the degrees of freedom associated with the adjusted treatment sum of squares and the degrees of freedom for the error sum of squares: [2024/7m/7c(ii)]
Differentiate between randomised block design and balanced incomplete block design. In usual notations, for a balanced incomplete block design, prove that (i) (ii) and (iii) . [2023/20m/8a]
Consider the following data given for a BIBD with and :
| Treatment | Block 1 | Block 2 | Block 3 | Block 4 |
| 1 | 73 | 74 | – | 71 |
| 2 | – | 75 | 67 | 72 |
| 3 | 73 | 75 | 68 | – |
| 4 | 75 | – | 72 | 75 |
Analyse the design. [Given that: ] [2022/15m/7a]
In usual notations, if and are the parameters of a Balanced Incomplete Block Design, then show that: (i) (ii) [2021/10m/5b]
Describe BIBD and show that , where symbols have usual meanings. [2020/10m/5e]
Discuss Simple Lattice Design. Let denote row block effects and denote column block effects and denote the effect of treatment, where number of treatments . How do you test the hypothesis using ANOVA table? [2020/20m/8a]
Define BIBD. State the parametric relationships of the BIBD with usual notation. Also prove the inequality (with usual notation). [2019/15m/7c]
What do you understand by Balanced Design? Suppose four treatments (1, 2, 3, 4) are laid out in five blocks (I, II, III, IV, V) as given below:
| I | 1 | 1 | 2 |
| II | 1 | 2 | 2 |
| III | 3 | 4 | |
| IV | 3 | 4 | |
| V | 3 | 4 |
Establish that the above design is unbalanced. [2018/20m/6a]
Explain the concept of balanced incomplete block design (BIBD). What are the conditions for existence of a BIBD? If , then form a number of blocks, each of order 3, such that each pair of elements in is contained in exactly one block. [2017/10m/5e]
Let be the incidence matrix of a BIBD of order . Show that . [2016/15m/6b]
Prove that the necessary and sufficient condition for a design to be connected is , being the number of observations. [2016/15m/7b]
Define a balanced incomplete block design (BIBD). Carry out its intrablock analysis. [2015/20m/7a]
Construct an LSD of size 5. Delete one column from this LSD. Prove that the resulting design is a symmetrical BIBD with parameters , and . [2014/15m/6c]
Consider a BIBD with parameters , and . Obtain c matrix of this design and its non-zero eigen value. Hence obtain . [2014/20m/8a]
What do you understand by a connected block design? The following is the incidence matrix of a block design with four treatments and five blocks: Compute the C-matrix of the design. [2013/10m/5d]
Let be the C-matrix of a block design with parameters and let be the vector of adjusted treatment totals. Show that, under the usual additive fixed effects linear model and where is the vector of treatment effects and is the common experimental error variance. Also show that is estimable if and only if lies in the row space of . [2013/20m/6a]
Show that for a BIBD with for , a positive integer, . Show that for a symmetrical BIBD with even, is a perfect square. [2013/20m/7a]
Discuss on the advantages of using a BIBD. For a BIBD with parameters , show that and . Also examine whether a BIBD is possible with , and . [2012/20m/7c]
Construct a pair of orthogonal Latin squares with symbols and respectively. Superimpose one onto the other. Numbering the small squares from 1 to 9, use this arrangement to construct a balanced incomplete block design with parameters , , , and . [2011/20m/7c]
Define a BIBD. Show that for a BIBD with parameters , , , and , (i) and (ii) . [2009/12m/5f]
When is a BIB design said to be resolvable? Show that for a resolvable BIBD. (in usual notations). [2007/20m/8c]
What is a BIBD? Write down the parameters of a BIBD, and state and prove the relations that serve as a necessary condition for the existence of a BIBD. [2006/20m/8c]
Define an m-ple lattice design with its parameters and give its analysis. [2005/20m/8b]
If D denotes a BIBD with parameters and denotes its complementary design with parameters , then show that, . [2003/12m/5e]
Define simple lattice design. Construct a simple lattice design taking 16 treatments. Derive the complete analysis of simple lattice design. [2003/20m/8c]
For a BIBD , prove that [2001/15m/8ii]
Establish the parametric relations of a BIBD with parameters . Show that in a symmetric BIBD, the number of treatments common between any two blocks is . [2000/12m/5f]
Define a simple lattice design and derive its complete analysis. [1999/30m/13a]
Define a balanced incomplete block design and show that it is a balanced design. [1999/15m/13b]
Prove that a balanced incomplete block design with parameters , and cannot be constructed. [1999/15m/13c]
Give an outline of the analysis of balanced incomplete block design and obtain its efficiency compared to a randomized block design. [1998/25m/4b]
In what situations is the use of incomplete designs recommended? In the usual notations, show that for a BIBD. [1997/20m/4b]
What is a simple lattice design? Explain the analysis of data arising from such a design. Also explain a method of testing whether a linear contrast of the treatment effects is zero or not. [1997/20m/4c]
Define a BIBD. Show that the parameters of a BIBD satisfy the relations (i) (ii) [1996/20m/3c]
Write an explanatory note on simple lattice designs. [1996/20m/4c]
Define a BIBD and show that (i) (ii) and (iii) , where v, b, r, k, are the parameters of the design. [1995/20m/3c]
4.10] Factorial experiments
46 questions
Distinguish between complete confounding and partial confounding. [2026/5m/8c(i)]
Illustrate how you will partially confound a -factorial experiment into blocks in 2 replicates with no main effects confounded. State the confounded effects in each replicate. [2026/10m/8c(ii)]
(i) Explain the need of factorial experiments with an example from pharmaceutical study. (ii) Divide the 16 treatments of factorial experiment into 4 blocks of 4 treatments each, confounding the interaction effect and completely with blocks. Which other interaction is automatically confounded in this design? [2025/15m/7b]
A -factorial design was used to develop the yield of a crop. Two factors and were used at two levels: low and high . The experiment was replicated two times with completely randomized way. The data obtained are as follows:
| Factor A | Factor B | Estimated Average Effect |
| – | – | |
| + | – | 8 |
| – | + | –5 |
| + | + | 2 |
The sum of squares of all the yields = 510·5 The grand total of all the yields = 50·00
(i) Analyze the data and identify the significant factors. [2024/12m/8a(i)]
(ii) Develop the regression model and predict the yield when and both are at low level . [Given, ] [2024/8m/8a(ii)]
Explain the concept of confounding in design of experiment. In an experiment with three factors A, B and C, each at two levels, three replicates are divided in two blocks, each of four units. How will you confound ABC in the first, AC in the second and BC in the third replication? [2023/15m/8b]
In a – factorial experiment, the key block is given as: (1), ab, cd, ef, ace, abef, abcd, bce, cdef, acf, ade, abcdef, bde, bcf, adf, bdf. Identify the confounded effects. [2022/10m/5d]
(i) What is confounding in factorial experiments? (ii) A factorial experiment is conducted in blocks of size . Write the confounded effects such that no main effect or two factor interaction are confounded. Give the list of independent and generalised interactions confounded along with the elements of key block only. (iii) Give the break-up of degrees of freedom for a factorial experiment in blocks. [2021/20m/7a]
What are split-plot designs? When do you recommend the use of such designs? If and are the main plot and sub-plot errors respectively, both estimated in units of a single sub-plot, explain why is expected to be larger than . [2021/15m/8c]
What do you mean by Partial Confounding? Describe a -factorial design arranged in 2 blocks with 4 replications, where , , and are confounded. Also prepare ANOVA table for such design. [2020/15m/7c]
(i) Distinguish between total and partial confounding in a factorial experiment. (ii) If a factorial experiment is laid in a block of size 4 with four replicates, write down the allocations of degrees of freedom for analyzing the results of such a design when the highest order interaction is totally confounded. [2018/10m/5c]
A experiment involving factors A, B, C, D and E is conducted in the blocks of size 8. The key blocks in the replicates 1 and 2 are respectively given by and . Identify the confounded effects in each replication. [2018/15m/7b]
Distinguish between a factorial experiment and a number of single-factor experiments. What is meant by confounding in a factorial experiment? Why is confounding preferred even at the cost of loss of information on the confounded effects? [2017/15m/6c]
Construct design with minimum number of replicates achieving balance over 3-factor and 4-factor interaction effects without confounding any main effect and 2-factor interaction effect. [2016/15m/8c]
Describe the layout of a experiment in 4 replicates (with 3 blocks per replicate) using complete confounding. [2015/10m/5e]
What is meant by confounding in a factorial experiment? Why is confounding used even at the cost of loss of information on the confounded effects? Explain the terms ‘complete confounding’ and ‘partial confounding’. [2015/15m/8b]
Construct a key block of confounded factorial experiment into a block of size 8 by choosing suitable interactions only. Write all the independent and generalized confounded interactions. Further obtain two or more blocks using key block. [2014/15m/7c]
In a factorial experiment, each replication is divided into 3 blocks of size 9 each and the effect is totally confounded. Explain the analysis of the experiment and set up the ANOVA table. [2012/20m/8c]
Suggest the confounding scheme of a -design to be carried out in 4 replicates each comprising 4 incomplete blocks of size 4, such that full information is retained on the main effects, each of the first-order and second-order interactions is confounded only in one replicate, while the third-order interaction is confounded in two replicates. Give the complete layout of one such replicate indicating the factorial effects confounded in it. [2011/12m/5d]
Introduce the concepts of confounding, total confounding, partial confounding and balanced confounding in the context of a factorial design. A -design has been conducted using 4 replicates each comprising 3 incomplete blocks of size 3 each. In two of the replicates, has been confounded, while in the remaining two, has been confounded. Write down the ANOVA table. Indicate how the sums of squares due to different factorial effects will be calculated. [2011/20m/6c]
Distinguish between – and -factorial experiments. Explain, how you will get sum of squares due to main and interactions in -factorial experiments. Give format of ANOVA table for -factorial experiment mentioning degrees of freedom if randomized block design having blocks containing 9 plots each is used. [2010/20m/6b]
Suggest a balanced confounded design of a experiment in 3 replicates, each replicate containing 4 incomplete blocks of size 4 each, retaining full information on the main effects and the 2nd order interactions. Give the complete lay-out of one such replicate indicating the factorial effects confounded in it. [2009/12m/5e]
3 factors, each at 2 levels, are to be tested in a single experiment using randomised blocks. Using standard notation, give the expressions for the sums of squares due to different factorial effects. Also give the ANOVA table. [2009/20m/7c]
When do you use a split plot design? Give the blank ANOVA table for a split-plot experiment. [2007/12m/5e]
Explain the concept of confounding in a factorial experiment. [2007/20m/8a]
Explain confounding in factorial experiments. Differentiate between complete and partial confounding. Set up a statistical model for a two-factor factorial experiment in RBD and give the ANOVA table with expected mean squares. [2006/20m/8b]
Give the ANOVA table for a experiment in blocks of 8 plots each, such that no main effect or first order interaction is confounded. [2005/12m/5f]
Explain the concept of balance in the context of a confounded factorial experiment. [2005/20m/8a]
Find a confounding arrangement of a factorial experiment in 4 blocks such that no main effect or first order interaction is confounded. [2004/12m/5e]
Construct a confounded factorial experiment into 8 blocks of 8 treatments each by confounding the effects ABEF, ABCD and ACE. Also, identify the other effects which are confounded. [2004/20m/8c]
Define total and partial confounding. In the following arrangement of factorial designs, identify the confounded factorial effects:-.
| Replicate I, Block I | Replicate I, Block II | Replicate II, Block I | Replicate II, Block II | Replicate III, Block I | Replicate III, Block II |
| abc | ab | abc | ac | abc | ab |
| a | ac | ab | bc | bc | ac |
| b | bc | c | a | a | b |
| c | ‘1’ | ‘1’ | b | ‘1’ | c |
[2003/12m/5f]
Define symmetrical factorial experiment. Obtain all possible main effects and intersections for factorial experiment. Discuss Yates method of analysis of factorial experiment. [2003/20m/8a]
Define, giving examples, the terms ‘main effects’ and ‘two factor interactions’. [2002/12m/5e]
Give, in detail, the analysis of -factorial experiment conducted in r randomized blocks. [2002/20m/8a]
Explain the structure of a split-plot design, giving a practical situation where it can be used. Derive the expected value of mean square due to whole-plot treatments. [2002/20m/8c]
Choose the most appropriate answer: (i) The main reason for forming blocks in experimental designs is ……….. (error control, replication, increasing inductive scope) (ii) The correlation coefficient of y on x is 0.5. This means the proportion of the variability in p accounted for by x is …………….(75%, 50%, 25%) (iii) In a design, the main effects are confounded with the block effects. (Split Plot, Latin Square Randomized Blocks) (iv) In a sample of size n, drawn from a population of size N, drawn by the method of simple random sampling without replacement, the probability that a particular unit is included is ……………… [2001/12m/5a]
Construct a non-randomized layout of a partially confounded factorial experiment in four replicates, confounding second order interaction effects only in each replicate. What property does this design exhibit in respect of the loss of precision of the confounded effects? [2000/16m/8b(ii)]
Why do we need to develop split plot design? Write down the model of the design and give the estimates of the parameters involved in the model. Write down the ANOVA table and give the expressions of the estimates of standard errors for the different types of comparisons. [2000/18m/8c]
Explain the technique of confounding. Indicate the method of construction of a design, retaining full information on the main effects. [1999/30m/14b]
Write a note on fractional replication. [1998/15m/3c]
Comment on the necessity, advantages and disadvantages of factorial experiments and explain the “odd and even rule” for writing down the expressions for main effects and interactions in factorial experiments. [1998/20m/4a]
Write an explanatory note on split-plot experiments. [1998/15m/4c]
For a factorial experiment with 3 replications, each containing 4 blocks, obtain a design such that no main effect is confounded and any interaction is confounded not more than once. Also obtain the variance of the estimate of a main effect and that of a confounded interaction. Further explain how you will calculate the sum of squares due to a confounded interaction. [1997/20m/3c]
What is a split plot design? When is it recommended? Explain the analysis of data arising from such a design where the main unit treatments are arranged in a latin square. Also explain how you will compare the effects of (i) two sub-unit treatments within a main unit, (ii) two main unit treatments, and (iii) two sub-unit treatments in two different main units. [1997/20m/4a]
What are factorial experiments? Illustrate the concept of total confounding in such experiments. [1996/20m/4b]
What are factorial experiments? Give an illustration. State the advantages of these experiments over one-factor experiments. [1995/20m/4a]
Explain and illustrate total and partial confounding in factorial experiments. [1995/20m/4b]

Strengthen your GS papers
Our UPSC Mains Topic-wise & Year-wise PYQ eBook (2013–2026) maps every GS question to the syllabus, so you know what UPSC asks and how often.
View the BookDownload Free Sample« Previous: Linear Inference and Multivariate Analysis | Next: Industrial Statistics »
Back to: Statistics Optional PYQs – Topic-wise | Also see: Statistics Optional year-wise question papers
Last updated: 31 October 2026