
Here are all 218 Linear Inference and Multivariate Analysis questions asked in UPSC Statistics Optional Paper I from 1995 to 2026, arranged under the 7 topics of the official syllabus. Within each topic the latest questions come first.
Each question ends with a code such as [2024/15m/3b] – the year, the marks, the word limit (where UPSC set one) and the question number in the paper.
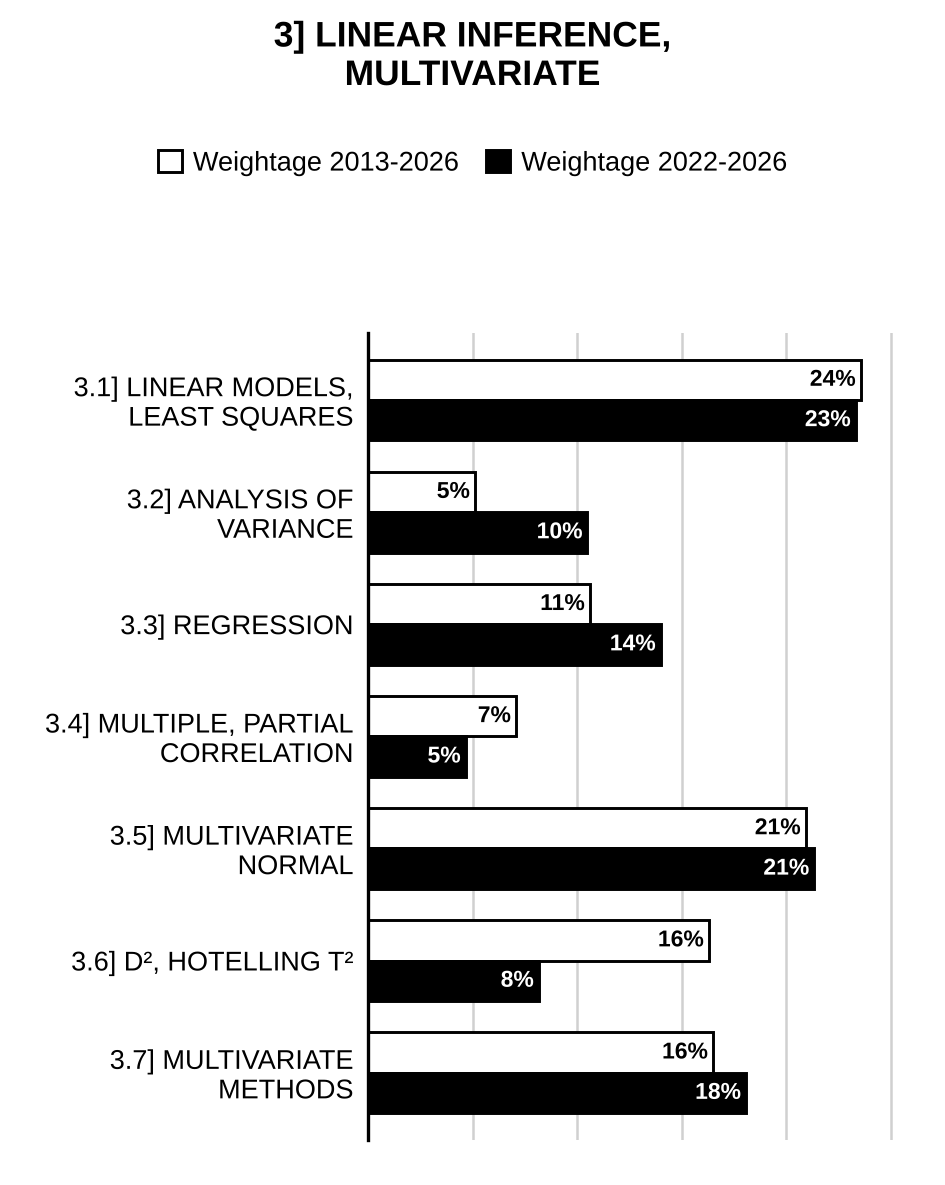
3.1] Linear models and least squares
48 questions
Let be independent observations from a population with mean and variance . Obtain the best linear unbiased estimator of and an unbiased quadratic estimator for . [2026/10m/5a]
Discussing Gauss-Markov linear model with and = variance and covariance matrix of , show that [2026/10m/5c]
Let be any estimable linear function of parameters . Then prove that– (i) there exists a unique linear function of random variables such that and , where is the vector space generated by row vectors of and ; (ii) variance of is less than the variance of any other linear unbiased estimator. [2026/20m/6a]
If is a random sample from a standard normal population, then using quadratic forms show that the sample mean and sample variance are stochastically independent. [2025/10m/5c]
Consider the model: where is an vector of unobservable random variables such that and , unknown, is a positive definite matrix of known constants and . Then (i) Derive least square estimator of and (ii) Derive an unbiased estimator of [2025/15m/6c]
How will you justify the usage of the principle of least squares in estimating the parameters of a linear regression model? With usual notations, for the regression model , show that the least square estimator of is [2024/10m/5a]
Let three mutually independent variables and having common variance and be given. Show that the linear parametric function is estimable if and only if , clearly stating the assumptions used, if any. [2023/5m/6b(ii)]
Define general linear model with usual assumptions. If where are mutually independent random variables with mean zero and variance , then find the least square estimators of and . [2022/10m/5a]
(i) What are orthogonal polynomials? How do you fit an orthogonal polynomial of degree ‘’? (ii) For the model , where is a matrix of rank , find out the value of [2022/20m/8a]
Define Gauss-Markov linear model. State and prove necessary and sufficient condition for the linear function of the parameters to be linearly estimable. [2020/10m/5d]
Let be uncorrelated variables with common variance such that Compute residual mean square. [2020/10m/6b]
In order to estimate two parameters and , a number of independent measurements are taken, each having errors with mean zero and variance . Suppose there are (i) observations with mean , (ii) observations with mean , and (iii) observations with mean . Set up this in the form of a standard linear model. What are the least square estimates of and ? Find , and . [2019/10m/5a]
Consider a standard linear model with design matrix and unknown coefficients and . Which linear combinations have largest and smallest variance subject to ? [2019/10m/5b]
The period of oscillation, of a pendulum is where is the length of the pendulum and is the gravitational constant. The periods observed are () and lengths () of the pendulum, in an experiment. Assuming the errors of observations to be uncorrelated with zero means and variances , show that the best linear estimator of is [2018/10m/5a]
For a model where , , , find BLUE’s of , . Suppose the model is not correct and the true model is Find the bias of the BLUE’s obtained. [2018/15m/8c]
are four independent variables with , and (for ). Verify whether and are estimable. If so, obtain their BLUEs. Also obtain the variances of the BLUEs. [2017/10m/5a]
Show that in the model subject to , the estimator of is where . Note here that is , is , is and is of rank . [2017/15m/6b]
Let , and , where , and are iid . Obtain best linear unbiased estimator (BLUE) of . Is this linear parametric function testable? [2017/15m/7c]
If and be two estimates of the estimable function , and and are the projections of and respectively on (the column space of coefficient matrix ), then show that . [2016/10m/5b]
Consider four random variables and with means and variances as follows: Determine the condition of estimability of the parametric function [2016/15m/6c]
Consider three independent random variables , and having common variance and , , . Determine the condition of estimability of the linear parametric function . Obtain a solution of the normal equation and the S.S. due to error. [2015/10m/5c]
For the Gauss Markov Model , the estimator is the best linear unbiased estimator (BLUE) for iff is uncorrelated with all unbiased estimators of zero. [2015/15m/6c]
Let be three independent observations having expectations Obtain least square estimates of , and . Can you obtain unbiased estimate of ? Justify your claim. [2014/10m/5a]
In the Gauss-Markov set up a least square estimate is given by a solution of the system: (i) Justify the above statement. (ii) Establish that the above system of equations is always consistent. [2014/15m/8c]
Consider the following linear model: where and are parameters, . ’s are all independently distributed. Derive normal equations and obtain the BLUE of . Also find the variance of the BLUE. [2013/10m/5a]
Consider a model , ’s are i.i.d. . Obtain least squares solutions of and . When is a linear parametric function of ’s (only) estimable? Derive a test statistic for testing . [2013/10m/5b]
and are independent stochastic variables with common variance and and (i) Examine whether is estimable. (ii) Find the best unbiased estimator of . (iii) Obtain the variance of the best unbiased estimator of . [2012/12m/5b]
Derive the normal equations for estimating the parameters of a linear regression model by the method of least squares. [2012/12m/5e]
Assuming the model where , and are the errors, obtain least square estimates of and . [2011/12m/5b]
Let be a random vector distributed as Derive necessary and sufficient conditions for the quadratic form to be distributed as . [2007/20m/6a]
In a Gauss-Markoff set-up, define an estimable parametric function. Show that if , then every parametric function is estimable where we consider the set-up [2007/20m/6c]
Discuss least squares method of estimation and the relation between least squares estimators and best linear unbiased estimators. [2006/20m/4a]
Consider the model with the usual assumptions. Determine so that the BLUE’s of and are uncorrelated. [2005/20m/6a]
Show that a linear function of observations belongs to the error space if and only if its coefficient vector is orthogonal to the columns of the matrix X in the usual linear model . [2004/12m/5b]
For the model show that is estimable if and only if . [2004/20m/6a]
If is a general linear hypothesis model of full rank. Find the estimate of the unknown parameter using appropriate method when the distribution of e is unspecified. [2003/12m/5a]
Fill up the blanks in parts (i), (ii) and (iii) and answer (iv). (i) The arithmetic mean of a positive valued statistical variable is than the reciprocal of the arithmetic mean of the reciprocal of the variable. (ii) If one observation is missing in a Randomized Block Design with v treatments and b blocks, in the Analysis of Variance Table, the number of degrees of freedom for treatments will be and that for error will be (iii) The Gauss-Markov Theorem requires the error components to have mean values, variance and all pair-wise covariance’s to be (iv) Write down the structure of the Analysis of Variance Table for a Latin Square Design of order m. [2001/12m/5c]
In connection with the Gauss-Markov linear models, what do you mean by Design matrix and Normal equations? Discuss the least squares principle and use it to derive the normal equations. [2000/12m/5a]
Identify, giving reasons, which of the following models are linear? Wherever possible, suggest a transformation that will result in a linear model for : (i) (ii) [2000/12m/5b]
Consider the following linear model Where ’s are i.i.d. variables (i) Show that is estimable if and only if and . (ii) Obtain the BLUe of and [2000/10m/6a]
State and prove Gauss-Markoff theorem. [1999/30m/9a]
and are uncorrelated observations with a common variance and expectations (i) Show that is estimable if and only if . (ii) Find an unbiased estimate of . [1999/30m/9b]
Discuss least square estimate and show that least-square estimates are the same as the best linear estimates in linear estimation. [1998/20m/9a]
For the model , we have , , then test statistic for , where , , , find the distribution of F and state its properties. [1998/25m/10b]
In connection with the problem of linear estimation, explain the terms ‘estimable parametric function’, ‘error function’ and ‘best linear unbiased estimator (BLUE)’. [1997/24m/9a]
Consider three independent random variables , and having common variance and Show that and are estimable. Find their best linear unbiased estimates. [1997/36m/9b]
With the usual Gauss-Markov linear model, define the estimation space and the error space. Obtain expressions for the SS due to error and the SS due to all possible BLUEs of parametric functions. Find the expectation of the former. [1996/30m/9a]
Let and be the LS estimators of two estimable functions and respectively. Obtain the variances and covariances of the estimators. [1996/30m/9b]
3.2] Analysis of variance
14 questions
Write down the model used in the analysis of a two-way classification with interactions, stating the assumptions. What are the hypotheses tested in this scenario? Obtain the expression for the sum of squares and complete the ANOVA. [2024/15m/8c]
Describe the complete analysis of two-way classified data with multiple (but equal) observations per cell, clearly stating the assumptions used. Also state two examples where such type of analysis is used. [2023/15m/6b(i)]
In a set of two-way classified data according to levels of factor A and levels of factor B, there is one observation in each cell. Show that the total number of error contrasts is . [2022/15m/6a]
Three sides of an equilateral triangle were measured by 5 persons with the following results:
| Sides \ Persons | A | B | C | D | E |
| 5.44 | 5.41 | 5.43 | 5.42 | 5.43 | |
| 5.43 | 5.41 | 5.42 | 5.43 | 5.44 | |
| 5.45 | 5.42 | 5.43 | 5.43 | 5.44 |
Is there any significant difference between (i) measurements by the persons and (ii) the sides of the triangle? [2017/20m/8a]
Write down the model used for one way analysis of variance. The lifetimes (in hours) of samples taken from three different brands of batteries gave the following: , , , , , , , and . Test the hypothesis that there is no difference in lifetimes for the three brands. Also write down the ANOVA . [2012/20m/6b]
Discuss the two-way analysis of variance model giving its analysis and ANOVA table. [2006/20m/8a]
Describe Tukey’s test for non-additivity for a two-way layout with one observation per cell. [2005/12m/5b]
Explain the concept of one-way classified data. Write the linear model for it Obtain the least square estimate of the parameters involved in it. [2003/20m/6c]
Describe an appropriate test for equality of means of several populations on the basis of independent samples drawn from them. [2001/15m/6iii]
In the case of two-way classified data with unequal number of observations per cell derive the expectation of the MS components of the ANOVA table. [1998/20m/9c]
Define contrasts, orthogonal contrasts and show that SS due to n observations is equal to the total SS due to the orthogonal contrasts. [1998/20m/10a]
Write down the model of a complete three-way classified data with equal number of observations per cell. Write down the corresponding ANOVA table. [1996/15m/10c]
Describe the model and the analysis of variance of a complete two-way classified data with equal () number of observations per cell. State clearly what you will do if the interaction effects (i) are not significant (ii) are significant. [1995/30m/9a]
In the case of two-way classified data with one observation per cell derive the expectations of the MS components of the ANOVA table. [1995/30m/9b]
3.3] Regression analysis
31 questions
Discuss orthogonal polynomial regression on a single variable along with its principal advantages. [2026/15m/6c]
For a two variable linear regression model , where , , for , if and are least square estimators of and respectively, derive expressions for , and . [2025/10m/5a]
For the simple linear regression model , where and are parameters and has zero mean and an unknown variance , find the estimates of and by the principle of least squares as well as the method of maximum likelihood. Examine whether they are identical. [2024/15m/6c]
Let be given observations, and suppose that where are unknown parameters and are mutually independent normal random variables with and . Also, is assumed to be unknown. Test the null hypothesis . [2023/10m/5c]
(i) What are orthogonal polynomials? How do you fit an orthogonal polynomial of degree ‘’? (ii) For the model , where is a matrix of rank , find out the value of [2022/20m/8a]
For a simple linear regression model (i) Derive the least square estimators of and , clearly stating the conditions assumed. (ii) For where is the fitted value, show that 1. 2. 3. 4. 5. The regression line passes through . [2021/10m/5a]
For the multiple linear regression model with two predictor variables and , show that the estimate of regression coefficient of is unchanged when is added to the regression model, whenever and are uncorrelated. [2021/10m/5c]
(i) For a second order polynomial model with one predictor variable, derive the least squares normal equations clearly stating the conditions assumed. How will you interpret the parameters in this model? (ii) Describe why it is recommended to work with predictor variables centred around the mean. Comment on fitted values of the response variable in this case. Prove your claim. [2021/15m/8b]
A student fits the following linear regression model to a given data: ’s are iid normal values (), where is unknown. The following information is available: 95% confidence interval for is: . Calculate what proportion of the total variability of the responses is explained by the model. Given that . [2020/10m/5a]
Consider a simple regression model based on observations. Show that the regression sum of squares is . Suppose the summarized data on 10 observations yield Estimate assuming positive correlation between and . Also obtain coefficient of determination. [2017/15m/8b]
Consider the simple linear regression model , . Show that if the s’ are equally spaced (i.e. for fixed values of and ), then is an equivalent reparametrization (in the sense that both the design matrices have the same column space). [2015/15m/7c]
Give the outline of the procedure, using ANOVA technique, for testing if the response variable is dependent on a fixed set of variables , based on an observed set of data on these variables. [2011/20m/6a]
Consider the mean vector for to be and for to be . The covariance matrices for , and are Fit the equation and calculate multiple correlation coefficient. [2010/12m/5d]
Obtain an expression for estimated value of for given by fitting a curve to given points , using least-square method. [2010/20m/8b]
Based on a set of data , , , discuss how you would use the technique of Analysis of Variance for testing the hypothesis that the regression equation of on is linear. [2009/20m/6b]
What are outliers in the context of regression analysis? How can you use Cook’s distance to detect outliers? [2007/12m/5a]
Describe curvilinear regression. Given that fit the exponential curve [?] applying the method of least squares. [2006/20m/6b]
Derive the Shapiro-Wilk statistic for testing normality of errors in a regression model. [2005/12m/5c]
Define regression analysis. Write the form of simple linear regression model. State the various assumptions of the model. [2003/12m/5b]
Explain the linear regression model. Calculate the least squares estimate of for a straight line model from the data.
| 0 | 1 | 2 | 3 | 4 | |
| y | 1 | 4 | 3 | 8 | 9 |
[2002/20m/6a]
Let , find estimate of m and b and express . [1998/20m/9b]
In the multiple linear regression model with normality assumption obtain confidence interval to find out whether the regression on the regressor variables is significant or not. [1998/15m/10c]
Using the linear regression model and n independent sets of observations, derive the tests for the following hypotheses (i) (ii) You may make the usual assumptions. In each case state clearly the alternative hypothesis you consider. [1997/30m/10a]
Explain how orthogonal polynomials are used in fitting regression curves. Develop an appropriate test for choosing the appropriate degree of orthogonal polynomial using ANOVA table. [1997/30m/10b]
Given two regression lines show that the F-statistic for testing can be put in the form Write the expression of . [1996/20m/10a]
In the multiple linear regression model with independent variables, derive a test to find out whether the regression on the regressor variables is significant or not. Show that the test statistic can be expressed in terms of the sample multiple correlation coefficient. [1996/25m/10b]
Show that under usual normal population regression model the joint distribution of the partial regression coefficients is multivariate normal. [1996/30m/11b]
In the multiple linear regression model with k independent variables, is the estimated regression coefficient for the independent variable . Show that the statistic for testing the hypothesis is provided by where is the estimated variance of . What is the critical region for the alternatives ? [1995/30m/10a]
In the multiple linear regression model with usual normality assumptions obtain the confidence interval for a regression coefficient which is symmetric with respect to . [1995/15m/10b]
Indicate, with the help of the ANOVA table, how you will test for the linearity of regression. [1995/15m/10c]
What are orthogonal polynomials? State how these are used in fitting regression curves and obtain the LS estimates of the coefficients in the regression equation. Indicate how the technique of ANOVA is used in deciding the appropriate degree of the polynomial to be fitted. [1995/30m/12b]

Preparing for Prelims too?
Our UPSC Prelims Topic-wise PYQ eBook covers every Prelims question with detailed explanations, so you can see exactly where UPSC asks from.
View the BookDownload Free Sample3.4] Multiple and partial correlation
23 questions
If , and are three variables, obtain the expression for the partial correlation coefficient between and eliminating the effect of , , in terms of simple correlation coefficients. [2024/5m/5b(ii)]
Let be distributed as , where and Find (i) the conditional distribution of given . (ii) partial correlation coefficient and multiple correlation coefficient . [2023/15m/6a]
(i) If , where and are uncorrelated random variables and each of which has zero mean and unit standard deviation, find the multiple correlation coefficient between and . (ii) Let be a 3-dimensional random vector with dispersion matrix Determine the first principal component and the proportion of the total variability that it explains. [2022/15m/6c]
For a multiple linear regression model with three covariates and , let denote the correlation coefficient between and . For a data, it was found . (i) Check the consistency of the above data. (ii) If is unknown, obtain the limits within which lies given the above values for and . [2021/20m/6a]
Let Derive: (i) The joint distribution of , and (ii) The conditional mean of given and (iii) [2019/20m/7a]
For a random sample of size from , we obtain and (i) Find the estimates of the parameters of the conditional distribution of given . (ii) Find the partial correlation . [2018/20m/7a]
If , , , where , and are uncorrelated random variables and each of which has zero mean and unit standard deviation, find the multiple correlation coefficient between and , . [2016/10m/5a]
Let be a p-dimensional random vector with , . Define partial correlation coefficient between , . Show that where is the element of . [2015/10m/5b]
Define multiple correlation coefficient between and and show that where and are elements of the dispersion matrix and respectively. [2013/10m/5e]
If , and are the simple correlation coefficients between and ; and ; and respectively then show that Also examine the validity of the statement “the range of the partial regression coefficient is to .” [2012/12m/5c]
Suppose that follow the variate normal distribution with co-variance matrix Obtain the expression for the multiple correlation coefficient . [2012/20m/6a]
Suppose, with usual notation , , , , , . For predicting , the variable has already been included in the regression equation. Which one of and is worth including in the regression equation in addition to ? [2011/12m/5e]
Does the observed correlation between two variables and always imply causal relationship between them? Give an example. Define partial correlation coefficient between and eliminating from each the effect of . Why is more suitable for throwing light on the net correlation between and ? Based on the observed data set , and , derive the expression for . [2011/20m/8a]
Consider the mean vector for to be and for to be . The covariance matrices for , and are Fit the equation and calculate multiple correlation coefficient. [2010/12m/5d]
Examine, after deducing necessary result, if the following set of correlation coefficients are internally consistent: , and . [2009/12m/5b]
Describing briefly the concept of multiple regression, define multiple and partial correlations and obtain their formulae. [2006/12m/5a]
Establish the range of a multiple correlation coefficient. [2002/12m/5b]
Show that the correlation matrix is at least positive semi-definite. [2001/15m/7iv]
If and are the regression lines of x on y and y on x respectively, find the value of the 4 correlation coefficient between x and y. [2001/15m/8iii]
In standard notations, given that and . calculate [2001/15m/8iv]
If all correlations of order zero in a set of p variables are equal to , show that (i) every partial correlation of order s is and (ii) , symbols having usual meanings. [1999/30m/10a]
Define partial correlation coefficients in multivariate analysis. Show that [1998/20m/11c]
Let the covariance matrix of a four-dimensional normal random vector be given by Find the partial correlation coefficient between and components of X when the component is held fixed. [1995/15m/11c]
3.5] Multivariate normal distribution
47 questions
Define multivariate normal distribution and write down its important properties. Let , , and are mutually independent random vectors following . Then find the marginal distributions of (i) (ii) Also obtain the joint distribution of random vectors and . [2026/20m/8a]
Let , where Find the joint distribution of and . [2025/10m/5b]
Let , in which Obtain (i) and (ii) . [2025/15m/6b]
If is distributed as , find the distribution of . [2024/5m/5b(i)]
State the multivariate extension of (i) when follows . [2024/4m/6a(iv)]
(i) If is distributed as , find the distribution of . (ii) Suppose that , where . Is there a value of for which and are independent? [2023/10m/5a]
Show that has p-variate normal distribution if and only if every linear combination of follows a univariate normal distribution. [2023/10m/5b]
Let be distributed as , where and Find (i) the conditional distribution of given . (ii) partial correlation coefficient and multiple correlation coefficient . [2023/15m/6a]
Given , where and (i) find the regression function of on and , and (ii) compute the conditional variance of given and . [2022/10m/5b]
Let . Show that conditional on , the two components of are independent but marginally they are not. [2021/15m/6c]
Let with probability distribution function (pdf), where . Obtain and . [2020/10m/5b]
Let Derive: (i) The joint distribution of , and (ii) The conditional mean of given and (iii) [2019/20m/7a]
If is a -component vector of random variables distributed as , then show that is distributed as chi-square with degrees of freedom. [2018/15m/6b]
For a random sample of size from , we obtain and (i) Find the estimates of the parameters of the conditional distribution of given . (ii) Find the partial correlation . [2018/20m/7a]
Let have trivariate normal distribution , where and Show that has a chi-squared distribution. State the degrees of freedom. [2017/10m/5b]
If follows and is an matrix with rank , then show that [2016/20m/7a]
Let have the joint moment generating function (mgf) where . Then: (i) Obtain the covariance matrix and the mean vector of . (ii) Find a constant such that . (iii) Derive the conditional distribution of given and . (If necessary, you can use and where is a standard normal variate) [2015/15m/6b]
Consider a random sample from a p-dimensional normal population with mean vector and dispersion matrix . The purpose of the problem is to construct the likelihood ratio test (LRT) for testing . Find the maximum likelihood estimate (MLE) of and . Write down the expression for in terms of , , and the elements of the sample covariance matrix . [2015/20m/8a]
Let and be independent and identically distributed random vectors with mean vector and covariance matrix . Find the distribution of . [2014/10m/5e]
Let , where Obtain the conditional distribution of given . [2014/20m/6a]
Let be distributed as where , , and are -vectors and are matrices. Obtain the characteristic function of . Derive the distribution of . [2013/20m/8a]
follow where . Find such that and are independent. [2012/12m/5a]
Show that a necessary and sufficient condition for to be distributed as is that every linear function is distributed as univariate normal . [2011/20m/7a]
has 3-variate normal distribution with mean vector and covariance matrix , where Show that and are not independent but is independent of . Further show that and are also independent. [2010/12m/5b]
has 3-variate normal distribution with mean vector and dispersion matrix , where Derive the distribution of [2010/12m/5c]
Let denote a column vector of variables ’s. Prove that follows a -variate normal distribution iff there exists a random of independent standard normal variables ’s such that with probability one for some matrix of full rank and . [2010/20m/6a]
Let be distributed as (a -variate normal distribution). Prove that , where is matrix of rank , is distributed as . [2010/20m/7a]
Let be a random sample from -variate normal distribution , where , ; and is known. Define where and Prove that and are unbiased estimators of and . [2010/20m/8c]
The vector variable follows -variate normal distribution with mean vector and dispersion matrix . Obtain the distribution of . [2009/20m/6a]
Let , be i.i.d. random vectors, each having distribution. Define Show that for assuming E to be positive definite. [2007/12m/5d]
If is distributed as , find the distribution of [2006/12m/5b]
If , prove that every linear function of components of is univariate normal. [2006/12m/5d]
If have a joint normal distribution, show that a necessary and sufficient condition for one subset of random variables to be independent of the subset consisting of the remaining variables is that each covariance of a variable from one set and a variable from the other set be zero. [2006/20m/6c]
If X (with p components) is distributed according to , then prove that is distributed according to where D is a matrix of rank . [2004/12m/5a]
Let X be distributed , find the characteristic function of X. [2003/20m/6a]
Let be with Are and independent? What about independence of and ? [2002/12m/5a]
If X and Y are two independent p-dimensional random variables and if X + Y has a p-variate normal distribution, then prove that both X and Y have p-variate normal distributions. [2002/20m/6b]
Let . Let be a matrix of rank q. show that [2000/15m/6c]
and let C be a matrix of rank q. Prove that follows distribution. Explain how this can be used to find the marginal distribution of a q-component vector of X. [1999/30m/10b]
If then find when . [1998/5m/11a(i)]
If the probability density function of a random vector X is determine and . [1998/10m/11a(ii)]
Consider the sets of random variable and with vectors The marginal distribution of the set is multivariate normal with means, variances and covariances obtained by taking the proper components of and respectively. [1998/25m/11b]
Let and let Show that even if and are not independent. [1997/30m/11a]
Let X be a random vector with mean vector and dispersion matrix . Prove that X is distributed as if, and only if, for every coefficient vector , is distributed as . [1997/30m/11b]
Let be a vector of random variables with pdf . (i) Show that and (ii) Determine and . [1996/30m/11a]
If then show that the marginal distribution of each , where , and . Is the converse true? [1995/25m/11a]
If and are r- and s-vectors respectively with , then show that and are independently normally distributed. The partition of is [1995/20m/11b]
3.6] Mahalanobis’s D² and Hotelling’s T²
24 questions
Let be a random sample from . Show that Hotelling’s -statistic for testing against is a generalization of -statistic for testing against in the univariate case. Calculate -statistic for testing on the basis of the data taken from a bivariate normal distribution given below: [2026/15m/6b]
and are independent data sets of order and respectively from . Show that is distributed as , where , and and represent the Hotelling’s and Mahalanobis respectively. [2024/10m/5c]
(i) The data matrix of a random sample of size from a bivariate normal population is Test the null hypothesis against , where , at 10% level of significance. [You are given: ] (ii) Suppose and , observations are made on two random vectors and which are assumed to have bivariate normal distribution with a common covariance matrix , but possibly different mean vectors and . The sample mean vectors and pooled covariance matrix are Obtain Mahalanobis sample distance and Fisher’s linear discriminant function. Assign the observation to either population or . [2022/20m/7b]
Let , , , where : weight (in kg), : height (in cm) of infant. Sample data matrix Test at 5% level of significance the null hypothesis . [Given that: ]. [2020/20m/6c]
Define Hotelling’s-. Show that statistic is a function of likelihood ratio criteria. [2020/20m/7a]
Consider two independent i.i.d samples, each of size 10, from two bivariate normal populations. The results are summarised below. where , are sample covariance matrices and , are sample means. Provide suitable tests for the following hypotheses at level and draw your conclusion. (i) (ii) (iii) , where (You can use the following values: , , ) [2019/20m/6c]
Show that Hotelling’s is a generalization of the Student’s . Prove the invariance property of under the non-singular linear transformations of the variables. Briefly mention different uses of . [2018/15m/8b]
Suppose and observations are made on two random vectors and which are assumed to have bivariate normal distribution with a common covariance matrix , but possibly different mean vectors and . The sample mean vectors and pooled covariance matrix are Obtain Mahalanobis sample distance and Fisher’s linear discriminant function. Assign the observation to either population or . [2017/15m/7b]
The data matrix for a random sample of size from a bivariate normal population is Test the null hypothesis against , where , at 10% level of significance. [You are given: , ]. [2016/10m/5e]
If and be independent data matrices of order and respectively and if the rows of be identically and independently distributed as , then for and , show that denotes sample Mahalanobis distance statistic. [2016/15m/8b]
A random sample of size 4 from a bivariate normal population provides the following statistics where is the sample mean and is an unbiased estimator of the population dispersion matrix. Test the hypothesis where is the population mean vector. [2015/10m/5a]
If and denote two bivariate normal populations where and , , and . Compute the Mahalonobis distance between and . [2014/10m/5b]
Define Hotelling . State any one of its applications. A random sample of size 3 from a bivariate normal distribution gave following unbiased estimates of and Compute -statistic to test the hypothesis . [2014/15m/7b]
Let be a random sample from where and are unknown. Show that for testing against : not all ’s are equal, the test statistic can be expressed as where and are the sample mean vector and the unbiased estimator of respectively and . What would be the non null distribution of ? [2013/15m/6b]
Define Mahalanobis measure of distance squared between two populations with a common positive definite dispersion matrix and show that it is a non decreasing function of the number of characteristics. [2013/15m/7b]
Bring out the relation between Hotelling’s and Mahalanobis . Explain how can be interpreted as an extension of the student’s statistic. Describe the utility of Fisher’s discriminent function in classification problems. [2012/20m/7b]
In order to test the equality of mean vectors of define Hotelling’s -statistic and sketch the derivation of its null distribution. [2005/20m/6c]
Define Mahalanobis . Show that it is invariant under any non-singular linear transformation. [2002/12m/5f]
Let unknown and . Suggest a test for against : all s are not equal. [2000/15m/6b(ii)]
Define Hotelling’s . Show that it is invariant under non-singular linear transformations. Mention some uses of the statistic. [1999/25m/12b]
statistics is the generalization of t-statistic. Explain its relationship with -statistic. Explain the uses of statistic in test of hypothesis. [1998/30m/12a]
Let be a random sample of size N from , where is known. Develop a suitable test for testing the null hypothesis , where is a given vector. [1997/30m/12a]
Define Mahalanobis’ distance between two populations as estimated from the sample on the basis of p characters. State how the -statistic is used to test the hypothesis of no difference in mean values of the p characters. [1996/30m/12a]
Define Hotelling’s statistic and Mahalanobis’ statistic and state the relationship between the two. Describe the various uses of these statistics in test of hypotheses. [1995/30m/12a]
3.7] Multivariate methods
31 questions
Explain the problem of classification in discriminant analysis. In case of two known multivariate normal populations, define Fisher’s discriminant function and calculate it for the data given below: [2026/10m/5b]
(i) What are principal components? Show that the principal components are uncorrelated. (ii) Obtain the principal components and the amount of variation explained by each principal component associated with the following dispersion matrix: Comment on the results. [2025/20m/8a]
Define principal components and canonical correlation. How can one attain data reduction using principal components? If has covariance matrix then find the principal components. [2024/15m/6b]
State briefly three reasons why an analyst may wish to perform a principal component analysis. [2023/6m/6c(i)]
Define canonical correlations and give two examples of their application. Describe the procedure of working out canonical correlations and canonical variates. [2023/9m/6c(ii)]
(i) If , where and are uncorrelated random variables and each of which has zero mean and unit standard deviation, find the multiple correlation coefficient between and . (ii) Let be a 3-dimensional random vector with dispersion matrix Determine the first principal component and the proportion of the total variability that it explains. [2022/15m/6c]
(i) The data matrix of a random sample of size from a bivariate normal population is Test the null hypothesis against , where , at 10% level of significance. [You are given: ] (ii) Suppose and , observations are made on two random vectors and which are assumed to have bivariate normal distribution with a common covariance matrix , but possibly different mean vectors and . The sample mean vectors and pooled covariance matrix are Obtain Mahalanobis sample distance and Fisher’s linear discriminant function. Assign the observation to either population or . [2022/20m/7b]
What are principal components? Describe how to compute the principal components of the vectors and . Give and in terms of the principal components. [2021/15m/7b]
Two types of tests viz: written and oral were conducted for seeking admission to MBA course. The result of the test given by the students are as follows: Let : students eligible for admission to MBA course; : students not eligible for admission to MBA course If one student gets 29.0 marks in written test and 12.0 in oral test, classify the student as eligible or not based on Fisher’s linear discriminant function. Also find the probability of misclassification. [Given that ]. [2020/15m/8c]
Consider two sons born first in families. Let : head length of first son : head breadth of first son : head length of second son : head breadth of second son The measurements provide the sample variance covariance matrix that leads to the correlation matrix where Obtain the canonical correlations and hence the first canonical variables and interpret your result. [2019/15m/8b]
Define principal components. Is the principal component affected by standardization? Establish your claim by illustrating the same with the covariance matrix [2018/10m/5b]
Obtain first canonical correlation and its associated canonical variable pair for the following correlation matrix: [2017/20m/6a]
Suppose and observations are made on two random vectors and which are assumed to have bivariate normal distribution with a common covariance matrix , but possibly different mean vectors and . The sample mean vectors and pooled covariance matrix are Obtain Mahalanobis sample distance and Fisher’s linear discriminant function. Assign the observation to either population or . [2017/15m/7b]
Let has the following covariance matrix: Obtain the first three principal components using these values and the proportion of variations explained by the first two principal components. [2016/20m/8a]
Suppose a random vector has the covariance matrix . Find the principal components of and obtain the proportion of the total variance accounted for by the first two principal components. [2015/15m/7b]
Let has the correlation matrix given by Obtain the first two principal components and the population variance explained by the first two principal components. [2013/15m/8b]
Suppose has co-variance matrix Obtain the first two principal components of . [2012/20m/6c]
Bring out the relation between Hotelling’s and Mahalanobis . Explain how can be interpreted as an extension of the student’s statistic. Describe the utility of Fisher’s discriminent function in classification problems. [2012/20m/7b]
Explain briefly the method of factor analysis and its uses. [2007/12m/5b]
Briefly explain the development and use of linear discriminant functions in the context of two multivariate populations. [2007/20m/6b]
Discuss the procedure of classification of an observation into one of two known multivariate normal populations. [2006/20m/6a]
What is the purpose of MANOVA? Explain the one-way MANOVA model. [2004/12m/5f]
Explain the purpose of discriminant analysis. What is Fisher’s discriminant function for two populations? Give the allocation rule based on it. [2004/20m/6b]
Outlining the purpose of factor analysis, describe the orthogonal factor model along with its covariance structure. [2004/20m/6c]
What are the situations where discriminant analysis is used? Give some examples in support of your answer. Write the objectives of two group discriminant analysis. Explain how the discriminant criterion is calculated. [2003/20m/6b]
What are principal components? Discuss the method of finding them. [2002/20m/6c]
Define principal components and explain their significance in statistical practice. [2000/10m/6b(i)]
What are principal components? Explain the differences between principal components analysis and factor analysis. Briefly indicate how you can obtain maximum likelihood estimates of the principal components, given a random sample from where has all its characteristic roots distinct. [1999/35m/12a]
Let and and linear discriminant function is sufficient for the class of normal densities , , prove it. Discuss the methods used in it. [1998/30m/12b]
Define fishers discriminant function and obtain a test of the adequacy of a hypothetical discriminant function. [1997/30m/12b]
Define Fisher’s discriminant function between two p-variate populations. Indicate the connection between the discriminant function coefficients and the -statistic. Describe a test to judge the adequacy of a preassigned discriminant function. [1996/30m/12b]

Strengthen your GS papers
Our UPSC Mains Topic-wise & Year-wise PYQ eBook (2013–2026) maps every GS question to the syllabus, so you know what UPSC asks and how often.
View the BookDownload Free Sample« Previous: Statistical Inference | Next: Sampling Theory and Design of Experiments »
Back to: Statistics Optional PYQs – Topic-wise | Also see: Statistics Optional year-wise question papers
Last updated: 31 October 2026