
Here are all 271 Statistical Inference questions asked in UPSC Statistics Optional Paper I from 1995 to 2026, arranged under the 8 topics of the official syllabus. Within each topic the latest questions come first.
Each question ends with a code such as [2024/15m/3b] – the year, the marks, the word limit (where UPSC set one) and the question number in the paper.
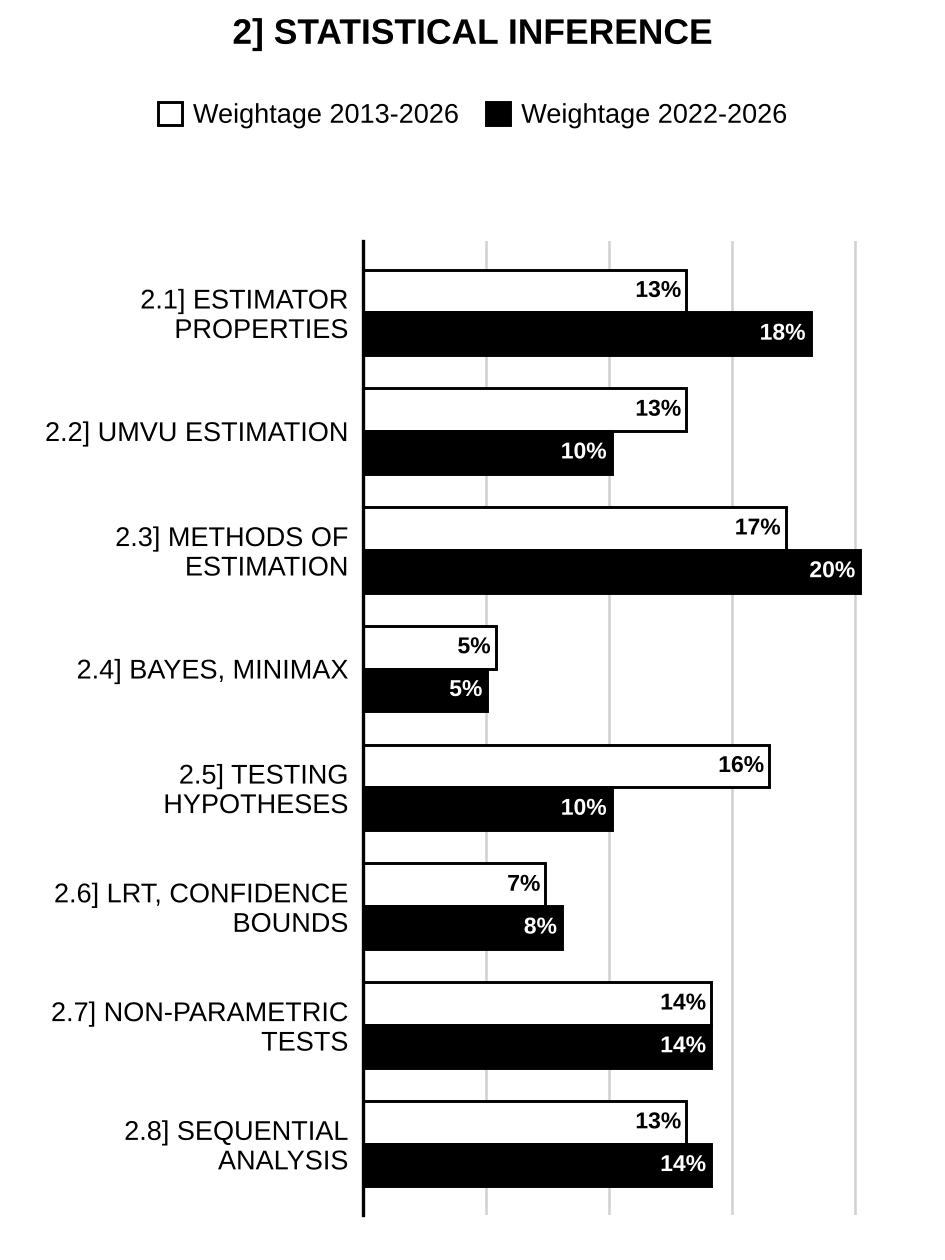
2.1] Properties of estimators
43 questions
Let be a random sample from a population with p.d.f. Show that is sufficient statistic of . [2026/5m/1d(ii)]
Prove that there always exists a sufficient statistic for the one-parameter exponential family of distributions. Using it, show that sample total is sufficient statistic for the parameter for the Poisson model. State whether this estimator is complete. [2026/15m/3c]
Let be i.i.d. random variables following . Find the maximum likelihood estimator for and examine whether the same is unbiased. If biased, suggest an unbiased estimator for and examine whether it is consistent. Also compare the mean squared errors of the estimators. [2026/20m/4a]
Let be a random sample from normal distribution. Obtain sufficient statistic for parameters when both the parameters are unknown. If is known, what will be sufficient statistic for parameter ? [2025/10m/1d]
Let be a random sample from beta distribution of first kind . Find consistent estimator of , and its variance also. [2025/15m/3c]
Write the criterion of a good estimator. Let be iid random variables, then show that is sufficient while is not sufficient for estimating . [2024/10m/1d]
Let and be two unbiased estimators of with , then show that where is the efficiency of each estimator. [2022/10m/1d]
Let be the order statistics from uniform population having probability density function Show that is an unbiased estimator of . [2022/15m/2c]
Let be a random sample from uniform distribution . Show that is sufficient statistic for but not complete, where [2020/20m/3a]
Suppose and are independent and identically distributed (i.i.d) observations from the pdf given by Show that is an ancillary statistic. [2019/10m/1c]
is a random sample from probability density function (i) What is a sufficient statistic for ? (ii) Find the Maximum Likelihood Estimate (MLE) of . (iii) Find the Method of Moments (MoM) estimate of . [2019/20m/2a]
Let be one observation from the pdf (i) Is a complete sufficient statistic? Check also if is a complete sufficient statistic. (ii) Does belong to exponential class? (iii) Find the MLE of . [2019/20m/3a]
Let be a random sample from uniform population over and let . Show that is a biased but consistent estimator of . [2017/10m/1e]
Given a random sample from with all parameters unknown. Write down the likelihood function . Show that for all and comment. Now find for any and hence establish that is a consistent estimator of . [2016/20m/3a]
Define a sufficient statistic. If and are Bernoulli random variables, examine the sufficiency of and for where and . [2015/10m/1c]
Let and be i.i.d. random variables and each has probability density function If and , decide which one of and are sufficient statistics for . If , then show that it has smaller variance compared to . [2014/10m/1d]
Let , be independent random variables following Poisson distribution with parameter . Show that is sufficient for . Verify if is also sufficient for . [2013/10m/1c]
is a random sample from the normal distribution with 0 mean and variance . Examine the validity of the following statements: (i) is consistent for . (ii) is unbiased for . (iii) is sufficient for . (iv) is the UMVUE for . [2012/12m/1e]
Define exponential family of distributions. Identify two distributions each which (i) belongs to the family and (ii) does not belong to the family. Substantiate your answer. [2012/20m/2a]
Obtain a sufficient statistic for in sampling from Check if it is complete sufficient. [2011/12m/1e]
The random variable follows uniform distribution in . Let be the order statistics in a random sample of size 3 from the population. Show that both and are unbiased for . [2011/20m/2c]
A city has taxis numbered 1 to . A person standing at a crossing noted numbers of taxis that pass that crossing (same taxi does not pass twice). If is the highest taxi number noted, find an unbiased estimate of based on . [2010/12m/1d]
Explain consistency of estimators. Prove that second smallest observation in a random sample of size from the following probability density function is consistent estimator of : [2010/20m/2c]
Define completeness of a statistic. Show that if a sufficient statistic is complete, then it is minimal sufficient. [2007/20m/3a]
If , , and and are independent, then show that is an unbiased estimator of for which the variance is minimized, when [2006/12m/1e]
Giving example, define sufficient statistics and state Fisher-Neyman criterion for the existence of sufficient statistics. Let be a random sample from the distribution that has p.d.f. Check whether is a sufficient statistic for . [2006/20m/3a]
Let be the order statistics of a random sample of size 3 from the uniform distribution having p.d.f. and zero elsewhere. Show that and are both unbiased statistics for . Find their variances. [2006/20m/4c]
Let be i.i.d. rectangular random variables. Is sufficient for ? Is it complete? Give reasons for your answer. [2005/20m/3a]
Let and be two unbiased estimators of having the same variance. Show that their correlation coefficient cannot be smaller than , where is the efficiency of each estimator. [2004/12m/1d]
Let be a sample from p.d.f. Show that is a minimal sufficient statistic for , but is not sufficient. [2004/20m/3a]
Suppose and are identically and identically distributed Poisson variates with parameter . Show that the statistic is not sufficient for . [2003/12m/1f]
Explain the concept of consistency. Show that for Cauchy’s distribution the sample median is a consistent estimator of the population mean. [2003/20m/3a]
Let X follow a Poisson distribution with parameter . Examine whether is unbiased for . In any case, comment on the suitability of the proposed estimator. [2002/12m/1d]
Establish the consistency of an estimator under a set of sufficient conditions to be stated by you. [2002/12m/1e]
Let be a random sample from a rectangular distribution with p.d.f., where . Examine if , the largest order statistic, is complete. [2002/20m/4c]
Define a consistent estimator for Show that is a consistent estimator of only if and as [2000/15m/3b(i)]
Given a random sample of size n from a Cauchy population with location parameter , show that the sample median is a consistent estimator of . [2000/10m/3b(ii)]
Define unbiasedness and consistency of the estimator. Obtain unbiased estimate of [?] from if is known. [1998/15m/5a(i)]
Does a sufficient statistics for exists in [1998/5m/5a(ii)]
Show that the family of binomial distribution with parameters n and is complete. [1997/20m/6b]
Let be a sequence of estimators such that and as . Show that is a consistent estimator for . [1996/15m/5b]
Define the empirical distribution function and find its expectation and variance. Hence show that it is a consistent estimator of the population distribution function. [1996/20m/8a]
Define bias, variance and mean squared error of an estimator t for a parameter . Obtain a relation [?] among these three quantities. [1995/20m/1a]
2.2] UMVU estimation
40 questions
Describe how Rao-Blackwell theorem enables one to find the UMVUE. [2026/5m/1d(i)]
Let be a random sample from Bernoulli distribution . Find the lower bound for the variance of an unbiased estimator of based on this data. Find uniformly minimum variance unbiased estimator of and show that it attains Cramer-Rao lower bound. [2025/10m/3b(ii)]
Write the importance of Cramer-Rao inequality and Rao-Blackwell theorem. [2024/5m/3b(i)]
Let , then find the uniformly minimum variance unbiased estimator (UMVUE) of . [2024/10m/3b(ii)]
What is the role of properties of completeness and sufficiency in Statistical Inference? Explain. In , find out Uniformly Minimum Variance Unbiased Estimator (UMVUE) of . [2023/20m/4a]
Let be a random sample from Is there a function of , say , for which there exists an unbiased estimator whose variance attains the C-R lower bound? If yes, find it. If not, show why not. [2021/10m/1d]
Let be a random sample from uniform distribution . Find the complete sufficient statistic for . Hence, obtain the best unbiased estimator of . [2021/15m/3c]
Let be a random sample from Poisson distribution with mean . Define a statistic (i) Show that is complete sufficient statistic. (ii) Show that is unbiased for . (iii) Show that even though is UMVUE, it does not attain the CRLB for . [2021/20m/4a]
Let be iid binomial random variables. Find the UMVUE for , based on the sample. [2018/15m/2b]
Let be independently and identically distributed observations from a distribution with probability density function . If is an unbiased estimate of , then Use this inequality to show that the sample mean is a uniformly minimum variance unbiased estimator of mean of a Poisson distribution. [2017/20m/2a]
Let be a random sample from a distribution with probability density function Find the maximum likelihood estimator (MLE) and minimum variance unbiased estimator (MVUE) of . [2017/20m/4a]
Let . Using Rao-Blackwell theorem, obtain a minimum variance unbiased estimator for , where is an integer. [2016/15m/4b]
Let and be i.i.d. random variables and each has probability density function If and , decide which one of and are sufficient statistics for . If , then show that it has smaller variance compared to . [2014/10m/1d]
Let be jointly distributed with probability density function Find Fisher information in a sample of pairs. [2013/15m/2c]
Using Rao – Blackwell Theorem, derive the uniformly minimum variance unbiased estimator (UMVUE) of an estimable parametric function based on a complete sufficient statistic. Obtain the UMVUE of where are independently identically distributed (i.i.d.) . [2013/20m/3a]
is a random sample from the normal distribution with 0 mean and variance . Examine the validity of the following statements: (i) is consistent for . (ii) is unbiased for . (iii) is sufficient for . (iv) is the UMVUE for . [2012/12m/1e]
Based on a random sample of size from the discrete Uniform distribution obtain the UMVUE of . Is this estimator consistent? [2012/20m/3a]
A random sample of size is taken from the Poisson distribution. Let be the number of observations which are equal to 0. Obtain an unbiased estimator for and improve the estimator using Rao-Blackwell theorem. [2012/20m/3c]
For the p.d.f. derive Rao-Cramer lower bound of variance of an unbiased estimator of . [2009/20m/3b]
Show that a necessary and sufficient condition for a distribution to admit an unbiased estimator with variance attaining the Cramer-Rao lower bound is that it belongs to the one-parameter exponential family. [2007/20m/3b]
Let X have the p.m.f. given by , and . Obtain the m.v.u.e. of . [2007/20m/3c]
Show that if and are UMVUE’s of their expectations, then is UMVUE of . [2005/20m/3c]
Let be a random sample of size n from a distribution , . Obtain the UMVU estimator of [2004/20m/4a]
State Chapman-Robbins inequality. Explain how it differs from Cramer-Rao inequality. [2003/20m/3b]
Let be a random sample from Where . Show that is a minimum variance bound estimator of and has variance . [2002/20m/4a]
Define Uniformly Minimum Variance Unbiased Estimator of a parameter. Explain the role of Lehmann-Scheffe Theorem in this context. [2001/15m/4ii]
If T be a sufficient statistic for an unknown parameter and U be any unbiased estimator of , then prove that of T such that is also an unbiased and has smaller variance than that of U. [2000/15m/3a(i)]
Let be a random sample from a Poisson distribution with p.m.f. where the parameter is unknown . Find the Minimum Variance Unbiased Estimator of . [2000/12m/3a(ii)]
Define a complete sufficient statistic. State Lehmann-Scheffe theorem and explain how it can be used for finding uniformly minimum variance unbiased estimators. [1999/30m/5a]
Let r be the observed number of successes in n Bernoullian trials with probability of success . Prove that r is a complete sufficient statistic for . Hence or otherwise, obtain the minimum variance unbiased estimators of (i) and (ii) . [1999/30m/5b]
State and prove Cramer-Rao inequality. Give its generalization for several parameters. [1999/30m/6a]
Let is an MVUE of and is any other unbiased estimator of with efficiency . Can any unbiased linear combination of and be an MVUE of ? Justify your answer,. [1998/20m/5b]
Discuss complete sufficient statistics and suggest the method to find MVUE for . [1998/20m/8c]
State and prove Cramer-Rao inequality and explain its importance. [1997/20m/5a]
Let be a random sample from a Bernoulli distribution with parameter . Obtain uniformly minimum variance unbiased estimator of . [1997/20m/5b]
State and prove Lehmann-Scheffe theorem and explain its significance in point estimation. [1997/20m/6a]
State and prove Rao-Blackwell theorem. State its importance. [1996/25m/5a]
Let be an MVU estimator of and an unbiased estimator with efficiency . Then can any unbiased linear function of and be an MVU estimator of ? Justify your answer. [1996/20m/5c]
State and prove the Cramer-Rao inequality for the variance of an unbiased estimator. State the regularity conditions needed. [1995/30m/5a]
Let T be an MVB estimator of , while S is an unbiased estimator with efficiency . If is the correlation between T and S, then show that . [1995/15m/5c]
2.3] Methods of estimation
35 questions
Let be i.i.d. random variables following . Find the maximum likelihood estimator for and examine whether the same is unbiased. If biased, suggest an unbiased estimator for and examine whether it is consistent. Also compare the mean squared errors of the estimators. [2026/20m/4a]
Let be a random sample from a population with probability density function . Obtain maximum likelihood estimate of . [2025/5m/3b(i)]
A random sample of size is taken from the exponential distribution with mean . Given that observations out of observations are less than ‘’. Show that minimum Chi-square estimate and maximum likelihood estimate of are same. [2025/15m/4b]
Obtain the maximum likelihood estimates of and for a random sample from the exponential population [2024/15m/3c]
A lot consists of some defective items. A random sample of 25 items has 6 defective items with probability and 19 non-defective items with probability . Then estimate using the following: (i) MLE method (ii) Minimum -method (iii) Modified minimum -method. [2024/15m/4b]
Theoretical probabilities in the four cells of a multinomial distribution are and , whereas the observed frequencies are 108, 27, 30 and 8 respectively, then estimate by maximum likelihood method. Also, obtain the standard error of the estimate. [2022/20m/3b]
Consider Poisson distribution Let be the frequency for and . Discuss how you obtain minimum chi-square estimate for . Does minimum chi-square method necessarily yield a sufficient statistic even if it exists? [2022/20m/4a]
Let be a random sample such that distribution with unknown. Show that one of the solutions of the likelihood equation is the unique MLE of . Obtain asymptotic distribution of MLE of . [2021/15m/2b]
For a group of policies, losses follow the distribution function A sample of 20 losses resulted in the following:
| Interval | Number of losses |
| 9 | |
| 6 | |
| 5 |
(i) Obtain maximum likelihood estimator (MLE) of . [2020/4m/1d(i)]
(ii) Find Cramer-Rao Lower Bound (CRLB) using MLE of . [2020/4m/1d(ii)]
(iii) Using CRLB and asymptotic distribution of MLE, obtain 95% confidence interval for . [2020/2m/1d(iii)]
Let be the unknown parameter and be a random sample from the distribution with the probability distribution function (pdf) Find maximum likelihood estimator (MLE) of and its mean squared error (MSE). [2020/15m/2c]
is a random sample from probability density function (i) What is a sufficient statistic for ? (ii) Find the Maximum Likelihood Estimate (MLE) of . (iii) Find the Method of Moments (MoM) estimate of . [2019/20m/2a]
Let be a sample from a distribution with density function Obtain an estimate of by method of moments. [2018/10m/1b]
Shots aimed at a target reach the plane of the target at a distance from the centre, where has the probability density function A hit is scored if . If shots are fired and there are exactly hits, these being at distances from the centre, prove that the maximum likelihood estimator of is given by [2018/20m/3a]
Let be observations, each independently uniformly distributed between and . Find a general form of maximum likelihood estimator (MLE) of . Verify that are both MLEs, where and . [2017/10m/1d]
Let be a random sample from a distribution with probability density function Find the maximum likelihood estimator (MLE) and minimum variance unbiased estimator (MVUE) of . [2017/20m/4a]
Consider the probability distribution , and . A sample of size 1 is drawn from the population and it is found to be 3. Obtain the maximum likelihood estimate of .
| 2 | 3 | 4 | 5 | |
| 0.25 | 0.25 | 0.25 | 0.25 | |
| 0.30 | 0.40 | 0.15 | 0.15 | |
| 0.10 | 0.30 | 0.45 | 0.15 |
[2016/10m/1d]
Given a random sample from with all parameters unknown. Write down the likelihood function . Show that for all and comment. Now find for any and hence establish that is a consistent estimator of . [2016/20m/3a]
How does one obtain moment estimators? If has the pdf and a sample of size 50 yields find moment estimators of and . [2015/15m/3b]
Suppose items are put on test simultaneously and the test is continued until items fail. Assuming an exponential failure distribution with mean life time , obtain the maximum likelihood estimator for and hence estimate . Also obtain the Fisher information about the parameter and show that the estimator is asymptotically normal. [2014/20m/3a]
A random sample is taken from the population with the probability density function where is a constant to be suitably chosen. Derive the maximum likelihood estimator of . Also show that is an unbiased estimator of the population variance. [2011/20m/3a]
Let be the lifetime of randomly selected patients of cancer. An estimate is required for the probability that a patient survives beyond time , i.e., . Find the maximum likelihood estimator of , if lifetime of the patients follow the following probability density function: [2010/12m/1e]
State the invariance property of maximum likelihood estimator (m.l.e.). Use this to obtain the m.l.e. of in sampling from [2009/12m/1d]
Given a random sample of observation from the rectangular distribution with p.d.f. find the m.l.e. of . [2007/12m/1e]
Given a random sample of n observation from a Poisson distribution , derive an estimate of based on the frequency of and work out its asymptotic variance. [2005/12m/1d]
Let X be a normal variate with mean and variance Estimate and by using method of moments. [2003/12m/1d]
Prove that if is the maximum likelihood estimator of and is a one-to-one function of , then is the maximum likelihood estimator for . [2003/20m/3c]
Stating the regularity conditions, show that the maximum likelihood equation has a solution which is consistent and asymptotically normal. [2002/20m/4b]
Obtain estimates of the parameters and of a Normal distribution using the method of moments. [2001/15m/2iii]
State the method of minimum Chi-square for estimating a parameter and show that for large sample, the minimum Chi-square equations and likelihood equations are identical, providing identical estimates. [2000/12m/1d]
A discrete random variable X has a distribution dependent on the specification of the values of a parameter as indicated in the following table. Find the MLE of when is an observation of X.
| x | 0 | 1 | 2 | 3 | 4 |
| , | 0.1 | 0.2 | 0.3 | 0 | 0.4 |
| , | 0.2 | 0.3 | 0.2 | 0.1 | 0.2 |
| , | 0.4 | 0.3 | 0.2 | 0.1 | 0 |
[2000/8m/3c]
A random sample of size n is drawn from a gamma distribution with parameters and p. Obtain estimators of and p, using the method of moments. [1999/15m/6b]
Explain the method of maximum likelihood for estimation of parameters. State important properties of maximum likelihood estimators and prove any one of them. [1999/35m/7a]
State the conditions under which maximum likelihood estimators are identical with those given by method of moments. [1998/10m/5c(i)]
Let be a random sample from a pdf Find method of moment estimator of . [1997/20m/6c]
State the properties of maximum likelihood estimators. [1995/15m/5b]
2.4] Bayes and minimax estimation
10 questions
A random sample of size is drawn from . Let the prior distribution of be , where , and are known. Obtain the Bayes estimator for under (i) squared error loss function and (ii) absolute error loss function. [2026/15m/4b]
Differentiate between prior and posterior distributions. In case of squared error loss function, find out the Bayes estimator for unknown parameter. [2023/10m/1e]
The life of an electric bulb, (in hours), follows the exponential distribution with mean life , where is an unknown parameter. The prior distribution of has a gamma distribution with mean 0.8 and standard deviation 2. The average life of a random sample of size 5 bulbs is 3.8 hours. Calculate the Bayes’ estimate of using the squared error loss function. [2016/15m/3c]
Consider observations from . Obtain the Bayes estimator for under quadratic loss function when a conjugate prior is assumed for . [2015/10m/1e]
Let and the prior distribution of is . Assuming squared error loss function, obtain the Bayes estimator for . Also obtain Bayes risk. [2014/15m/3b]
Let be distributed as and be the prior probability density of . Then obtain the Bayes estimator (under squared error loss) and the Bayes risk. [2013/15m/3c]
Assume that follow the Binomial, , and that the prior distribution of is the Uniform, . Find the Bayes’ estimator for using the squared error loss function. [2012/12m/1d]
is a random sample from Bernoulli population with parameter . Consider that has beta prior distribution with hyper-parameters . Obtain Bayes estimator for under quadratic loss function and hence obtain min max estimator for . [2010/20m/4c]
Explain the terms prior and posterior distributions. How are prior distributions selected? What is the role of conjugate prior distribution? [2005/12m/1e]
Let X be a binomial variate with parameters n and p . Using a quadratic error loss function and a priori distribution of p as . obtain the Bayes’ estimate for p. [2002/20m/3a]
Preparing for Prelims too?
Our UPSC Prelims Topic-wise PYQ eBook covers every Prelims question with detailed explanations, so you can see exactly where UPSC asks from.
View the BookDownload Free Sample2.5] Testing of hypotheses
46 questions
A random variable has the following distribution under and :
| 1 | 2 | 3 | 4 | 5 | 6 | |
| 0·01 | 0·01 | 0·01 | 0·01 | 0·01 | 0·95 | |
| 0·05 | 0·04 | 0·03 | 0·02 | 0·01 | 0·85 |
Find the best test of size 0·03 and its probability of type-II error for testing versus . Is it unbiased test? Why? [2025/10m/1e]
For testing vs. , a random sample of size 50 is drawn from a normal population with unknown mean and variance 200. If , then obtain the critical region. [2024/10m/1e]
Find the most powerful test of size for testing vs. , given a random sample of size 25 from population. [2024/20m/4a]
An urn contains 5 marbles of which are white and the others black. In order to test null hypothesis versus alternative hypothesis , two marbles are drawn at random. is rejected if both the marbles are white, otherwise is accepted. Show that probability of type I error in case of without replacement and with replacement schemes, both are less than 0.40, but power of the test under with replacement is higher than that of under without replacement scheme. [2022/10m/1e]
Let be the Cauchy pdf (i) Show that this family does not have Monotone Likelihood Ratio (MLR). (ii) If is one observation from , show that is sufficient for and hence the distribution of does have an MLR. [2021/10m/1e]
Let and be two iid random variables with normal distribution. Further, consider Bernoulli random variable with and which is independent of and . Define as For testing the hypothesis versus , consider the test Find such that the test size becomes 0.05. Also compute power of the test. [Given that: , , ]. [2020/10m/1e]
The lifetime in hours of each bulb manufactured by a particular company follows an independent exponential distribution with mean . To test the hypothesis versus , an experimenter sets up an experiment with 50 bulbs with 5 bulbs in each of 10 different locations to examine their lifetimes. To get quick preliminary results, the experimenter decides to stop the experiment as soon as one bulb fails at each location. Let denote the lifetime of the first bulb to fail at location , . Obtain the most powerful test of size 0.05 to test versus based on the available lifetimes. If the available data is 510, 9752, 5650, 12385, 230, 4225, 860, 300, 3000 and 1500, give your conclusion. [Given that: ]. [2020/20m/2a]
The manufacturer of a spot remover claims that his product removes 90% of all spots. If, in a random sample, 17 of 20 spots were removed with the manufacturer’s product, test the null hypothesis against the alternative hypothesis at the 0.05 significance level and comment. [2019/10m/1d]
Let have the pdf To test against , let and be a random sample of size 2. A test is defined by taking critical region as Determine size and power of the test. [2019/15m/2c]
Let be a random sample from . The variance is unknown. Derive the most powerful test for against , where is a fixed positive number. Is it a UMP test? [2018/15m/2c]
Let , , where.
| 1 | 2 | 3 | 4 | 5 | |
Find the best critical region of size . What is its power? [2018/15m/4b]
Let be a random sample from a normal population with mean and variance 25. For a sample size of , find the uniformly most powerful (UMP) test for testing the simple null hypothesis against the composite alternative hypotheses (i) and (ii) . [2017/15m/4c]
Consider a random variable with p.m.f. , ; . The following table gives the values of . Obtain the best critical region to test the null hypothesis against at level of significance .
| 0 | 1 | 2 | 3 | 4 | 5 | |
[2016/10m/1e]
The distribution under the null hypothesis of is uniform over and under the alternative hypothesis, the distribution is given by , for , for and . Obtain most powerful test of size 0.15 and find its power, based on a sample of size one. [2015/15m/2c]
Find a Most Powerful test for testing versus on the basis of a random sample of size . Here is the pdf of the random variable . [2015/15m/3c]
Let be a random sample drawn from a uniform distribution. Obtain a UMP test of size for testing against . [2014/20m/4a]
Let be a negative Binomial random variable with parameters and , being known and unknown. Suppose the problem is to test against . Find the UMP test for the problem and obtain its power function. [2013/10m/1d]
For one parameter exponential family obtain UMPU test for testing against . Further prove that . [2013/15m/3b]
The manufacturers of a certain brand of electrical switches claim that at least 80% of the boxes, containing 12 such switches each, will have no defective. Design a randomised test of exact size 0·05 based on the number of boxes, among a random sample of 8 examined, containing at least one defective. [2011/20m/4c]
What is a size- randomised test? For testing the null hypothesis that at most 50% of the 500 ml. packs of hair oil of a certain brand are underweight, against the alternative that the percentage is more, it is desired to examine 8 such packs chosen at random. Use the following information to design a randomised test of size 0·05:
| 0 | 1 | 2 | 3 | 4 | 5 | 6 | 7 | 8 | |
| ·0039 | ·0312 | ·1094 | ·2188 | ·2934 | ·2188 | ·1094 | ·0312 | ·0039 |
where is the probability mass function of a binomial variate with parameters , . [2009/12m/1e]
Define (i) most powerful test, and (ii) unbiased test of a simple hypothesis against a simple alternative. Show that a most powerful test is necessarily unbiased. [2009/20m/4c]
Define a monotone likelihood ratio family of distributions. Prove that the hypergeometric distribution is a member of the MLR family. [2007/20m/4a]
Let be a random sample from the rectangular population. Find a UMP test of the hypothesis (given) against all alternatives. [2007/20m/4b]
A drug manufacturer wants to test the efficacy of a new medication. Denoting by the percentage of all the patients given the medication who recover from the disease he sets up , . His test statistic is x, the observed number of successes in trials and he will accept the null hypothesis if . Find the probability of type I and Type II errors denoted respectively by and . What happens if the acceptance region is changed to ? [2006/12m/1d]
Let be a random sample from distribution, where is unknown. Show that there is no uniformly most powerful test of the simple hypothesis , where is a fixed number against the alternative composite hypothesis [2006/20m/3c]
Let be a random sample from a bivariate normal population with parameters . Find a UMPU test for vs. . [2005/20m/4b]
If a sufficient statistic T exists for the family , show that the Neyman-Pearson MP test is a function of T. [2004/12m/1e]
Let , be a random sample from Find the MP test of size for testing against . Also obtain its power. [2004/20m/3b]
Let the power function of every test of against [?] be continuous in . Show that a UMP -similar test is UMPU provided that its size is for testing against [2004/20m/3c]
A sample of size 1 is taken from probability density function, Find most powerful test of against [?], at level . [2003/20m/4a]
Find an MP test of size for testing against based on a sample of size 1. [2002/20m/3b]
Choose the correct answer for (i), (ii) and (iv) and answer (iii). (i) A, B and C are three arbitrary events. The expression for the event that “only A occurs” in terms of A, B, C is (ii) A coin is tossed three times in succession. If A is an event that there are at least two heads and B is the event that 1st throw gives head, the probability is………………. [1/8, 5/8, 3/8] (iii) State Neyman-Pearson Lemma for testing a simple hypothesis against a simple alternative. (iv) An estimate based on a sample of size n is called an asymptotically unbiased estimate of if……… ……. [2001/12m/1a]
Supply the missing word(s) (i) If A and B are independent events then the conditional probability is equal to………….. (ii) If , then the binomial distribution is …………….. (iii) If a hypothesis specifies the value of all the parameters of a density function, it is called ……………. (iv) Methods which are not concerned with testing or estimating the parameters of a density function of a given type are called…………. [2001/12m/1c]
Given a random sample of size n from a Bernoulli distribution, find the UMP size- test for against . Derive the power function of the test. [2000/10m/4a(i)]
Let be a test function such that where and if X has density which has monotone likelihood ratio in x where is real parameter, then show that the power function of the test is increasing in . [2000/10m/4a(ii)]
Let be the two independent observations from For testing , against the alternative , the is accepted when . Determine UMP test. [1998/25m/6a]
Define MP and UMP region. Compare them and show that a MP test is necessary unbiased. [1998/15m/6b]
Describe real valued function and the families with MLR. Obtain UMP test for against [1998/20m/6c]
Explain the concept of an unbiased test. Examine that whether a MP test is necessarily unbiased. [1997/16m/7a]
When is a family of pdfs said to have MLR in some statistic ? If is a random sample from exponential distribution with mean , verify whether the family of exponential distribution has MLR in some statistic . Obtain UMP test of size for testing against . [1997/22m/7b]
Let be a random sample from a pdf Obtain a level UMP test of against . Determine also its power function and sketch its graph. [1997/22m/7c]
Let be a real parameter and the random variable x have probability density with MLR in . Determine the size UMP test of against . [1996/30m/6a]
Let be a random sample from a rectangular distribution . Show that for testing against , any critical region W for which and which necessarily includes the sample point if is UMP at level . [1996/30m/6b]
On the basis of a random sample of size n from a distribution with pdf derive the MP critical region for testing against . Will this region be UMP against ? Will this region be also MP against ? [1995/30m/6a]
Let be a random sample from a distribution with pmf , if . Find the UMP critical region of size , for testing against . [1995/20m/6b]
When is a family of densities said to have monotone likelihood ratio? Show that the one-parameter exponential family of densities belongs to this class of MLR densities. [1995/10m/6c]
2.6] Likelihood ratio tests and confidence bounds
32 questions
Obtain the likelihood ratio test (LRT) for testing against , using a random sample of size taken from . [2026/10m/1e]
A survey of 400 families with four children each have the following distribution:
| Number of boys | 0 | 1 | 2 | 3 | 4 |
| Number of families | 16 | 89 | 145 | 118 | 32 |
Is this result consistent with the hypothesis that male and female births are equally probable at 5% level of significance? It is given that for 4 degrees of freedom and for 5 degrees of freedom . [2023/15m/4b]
Define Likelihood Ratio Test. In , where is unknown, find out LR test for testing against , where is the parametric space for . is the size of the test. [2023/15m/4c]
Suppose are i.i.d beta and are i.i.d beta . ’s are independent of ’s. (i) Find a Likelihood Ratio Test (LRT) of vs. . (ii) Show that the test in part (i) can be based on the statistic (iii) Find the distribution of , when is true and then show how to get a test of size . [2019/20m/4a]
Let and be independent random samples from and respectively. Find a confidence Interval for at confidence level . [2015/10m/1d]
A trial can result in one of three possible outcomes with probabilities , and respectively. Construct the Likelihood Ratio test of against the alternative that these probabilities are different from . The test needs to be constructed on the basis of n-trials. [2015/20m/3a]
Construct a 95% confidence interval for in from the following observed sample: . [2014/10m/1c]
A tourist resort is visited by tourists from many countries. The resort operator has the following data in the month of January, 2014:
| Country | USA | UK | Canada | Italy | Germany | France | Japan |
| No. of tourists | 22 | 12 | 18 | 10 | 20 | 18 | 30 |
The resort operator has a hypothesis that the proportion of tourists visiting in the month of January of any year is 2 : 1 : 2 : 1 : 2 : 2 : 3. Test this hypothesis at 5% level of significance (Given ). [2014/10m/1e]
When will the Neyman-Pearson test and likelihood ratio test be the same? Obtain the likelihood ratio test for testing against based on a random sample from the binomial, . [2012/20m/3b]
Describe the relationship between confidence interval estimation and testing of hypothesis. Let be a random sample from , known. Obtain a confidence interval for . [2012/20m/4c]
It is desired to test if average percentage of family income spent on food is the same in selected blocks of a district. Assuming the underlying populations to be normal and homoscedastic, indicate how you would use likelihood ratio test for the purpose. Show that the resultant test boils down to the usual -test. [2011/20m/3b]
A random observation belongs to a population having probability density function . Describe likelihood ratio test for testing against based on a single observation, when and [2010/20m/4b]
A group of 20 short distance runners were subjected to a month-long training. Discuss how you would examine if the training was at all effective based on their timings to clear 100 meters before and after the training, clearly mentioning the underlying assumptions, if any, the null and the alternative hypotheses, as also the size- critical region. [2009/12m/1f]
In sampling from , unknown, derive shortest confidence interval for . [2009/20m/2b]
Show that the likelihood ratio test, for the hypothesis that the means of independent normal populations with common variance are identical, boils down to -test. [2009/20m/3c]
Briefly describe the likelihood ratio test for equality of variances of k univariate normal populations. [2007/12m/1f]
Define a family of UMA confidence sets of an unknown parameter at confidence level . State a result giving a one-one correspondence between the family of UMA confidence sets and the family of acceptance regions of relevant UMP tests at level . [2007/20m/4c]
Given a random sample from , where both and are unknown, find the uniformly most accurate unbiased confidence interval . [2005/20m/3b]
For each , let be the acceptance region of the level- UMP test for against all alternatives. Show that defined by is, for varying [?] a family of UMA confidence sets at the level . [2004/20m/4c]
Explaining the notations describe Chi-square good-ness of fit test. [2003/12m/1e]
Define likelihood ratio test and discuss its consistency. [2003/20m/4c]
Bring out the relation between uniformly most accurate (UMA) confidence sets of confidence coefficient and uniformly most powerful non-randomized tests of level . [2000/12m/1e]
Suppose are i.i.d. observations where is known. Obtain the uniformly most accurate (UMA) sets for [2000/10m/4b(ii)]
Derive the likelihood ratio test for testing the hypothesis against on the basis of a random sample of size m from a normal distribution with mean and variance unity. [1999/15m/6c]
Given a random sample of size n from the p.d.f. derive the UMA confidence interval for . [1999/25m/7b]
, then [1998/10m/5c(ii)]
State the properties of L-R test and suggest the conditions where has the asymptotic chi-square distribution. [1998/25m/7a]
Let be a random sample from [?]. Determine the L-R test of against Examine, whether the test is unbiased. [1998/15m/7b]
Obtain 95% confidence interval for based on a random sample , from . [1997/20m/5c]
Let be i.i.d. random variables. Obtain a level Likelihood Ratio test of against . [1997/20m/8a]
Let X be a variable, where both the parameters are unknown. Determine the LR test of against based on a sample of size n. Determine the power function of the test. [1996/30m/7a]
Derive the asymptotic distribution of the LR test criterion for testing a simple null hypothesis in the one-parameter family of densities. [1995/30m/7a]
2.7] Non-parametric tests
38 questions
The lifetimes, in hours, of two brands of batteries are given below:
| Brand A | 40 | 30 | 40 | 45 | 55 | 30 |
| Brand B | 50 | 50 | 45 | 55 | 60 | 40 |
Examine whether the two brands are different with respect to average life using (i) Kolmogorov-Smirnov test and (ii) median test. [2026/15m/3b]
The life of 6 items of brand-A and 6 items of brand-B are given below:
| A | 40 | 62 | 55 | 35 | 48 | 88 |
| B | 50 | 70 | 65 | 30 | 45 | 92 |
Using Kolmogorov-Smirnov test, test whether the distribution of life of both the brands are same or not at 5% level of significance. [Given that ] [2025/15m/4c]
Differentiate between Mann-Whitney -test and Wilcoxon sign test. The following data pertain to APGAR scores of 15 pregnant women in two care programmes and :
| Programme A | 8 | 7 | 6 | 2 | 5 | 8 | 7 | 3 |
| Programme B | 9 | 9 | 7 | 8 | 10 | 9 | 6 |
Is there a significant difference in APGAR scores of pregnant women under the two care programmes? [Given, ] [2024/15m/4c]
Apply Run Test to test the randomness of the following sequence of H and T at 5% level of significance: HHHHHHTHHHHHTHTHHHH TTHHHHTHHHTTHHHHHH THHTTHHTHHH Given: , [2023/10m/1d]
The following data present the time (in minutes), that a commuter had to wait to catch a bus to reach his destination:
| Days | Time | Days | Time |
| 1 | 23 | 11 | 14 |
| 2 | 25 | 12 | 14 |
| 3 | 12 | 13 | 16 |
| 4 | 07 | 14 | 19 |
| 5 | 17 | 15 | 23 |
| 6 | 16 | 16 | 24 |
| 7 | 13 | 17 | 12 |
| 8 | 26 | 18 | 18 |
| 9 | 27 | 19 | 11 |
| 10 | 12 | 20 | 08 |
Use the sign-test at 0.05 level of significance to test the claim of the bus operators that commuters do not have to wait for more than 15 minutes before the bus is made available to them. [Given ] [2022/15m/4c]
A company’s trainees are randomly assigned to groups which are through a certain industrial inspection procedure by three different methods. At the end of the instructing period they are tested for inspection performance quality. The following are their scores:
| Method A: | 80 | 83 | 79 | 85 | 90 | 68 | |
| Method B: | 82 | 84 | 60 | 72 | 86 | 67 | 91 |
| Method C: | 93 | 65 | 77 | 78 | 88 |
Using the appropriate non-parametric test, determine at 0.05 level of significance whether the three methods are equally effective. [2021/15m/4c]
A random sample of 14 male students from a rural Junior High School and an independent random sample of 16 male students from an urban Junior High School were given a test to measure their level of mental health. The obtained data are given in the following table: Mental Health Scores of Junior High Schools’ male students:
| Rural | 28, 49, 42, 30, 33, 36, 49, 31, 41, 46, 41, 21, 20, 28 |
| Urban | 37, 22, 24, 24, 27, 44, 34, 26, 20, 26, 25, 45, 32, 40, 45, 25 |
Apply Median Test to test the hypothesis at 5% level of significance that their median mental health level scores are equal or not. [Given that ] [2020/15m/4c]
Weddell seals live in the Antarctic and feed on fish during long, deep dives in freezing water. The seals benefit from these feeding dives, but the food they gain comes at a metabolic cost. A set of researchers wanted to know whether feeding per se was also energetically expensive, over and above the exertion of a regular dive. They measured the metabolic cost of 10 feeding dives and for each of these also measured a non-feeding dive by the same animal that lasted the same amount of time. The data are given below:
| Individual | Oxygen consumption after non-feeding dive () | Oxygen consumption after feeding dive () |
| 1 | 42 | 71 |
| 2 | 52 | 77 |
| 3 | 60 | 83 |
| 4 | 67 | 96 |
| 5 | 82 | 107 |
| 6 | 82 | 113 |
| 7 | 81 | 121 |
| 8 | 81 | 80 |
| 9 | 96 | 128 |
| 10 | 104 | 143 |
Mention assumptions about the populations and carry out an appropriate non-parametric test of hypothesis that the energetic cost is the same for feeding and non-feeding dives at level . [2019/15m/4c]
The following data represents lifetime (hours) of batteries for two different brands:
| Brand A | 40 | 30 | 40 | 45 | 55 | 30 |
| Brand B | 50 | 50 | 45 | 55 | 60 | 40 |
Use the Median test to conclude if the two samples come from the same population. [2018/10m/1d]
Using Kolmogorov-Smirnov test, determine whether the sample data given below come from an exponential distribution with mean 4. The observations in the sample are (Given, , , ) [2017/15m/3c]
Test the hypothesis of no difference between the ages of 10 married couples using Mann-Whitney U-test for the sample data at 10% level of significance. (Use normal probability integral table):
| Age (in years) | ||||||||||
| Male | 26 | 43 | 35 | 38 | 33 | 42 | 40 | 44 | 25 | 31 |
| Female | 47 | 48 | 34 | 34 | 47 | 35 | 32 | 35 | 30 | 44 |
[2016/15m/3b]
Suppose that and have cdf and respectively. Given independent random samples and from these distributions, construct Mann-Whitney test of for all against the alternative that for at least one . Also indicate the test when the alternative is for some . State the test you would use when and are large. [2015/15m/4b]
A die is rolled 15 times with the following results:
| Face value | 1 | 2 | 3 | 4 | 5 | 6 |
| Frequency | 0 | 1 | 4 | 0 | 4 | 6 |
Use Kolmogorov-Smirnov statistic to test whether the die is unbiased or not. (Given ) [2014/15m/2c]
Use sign test statistic to find a non-trivial distribution free confidence interval for population median of a continuous distribution. [2013/10m/1e]
To compare two brands of tyres, the following milages (in ‘000’ miles) were obtained for 8 tyres of each kind: Brand A: 32.1, 20.6, 17.8, 28.4, 19.6, 21.4, 19.9, 30.1 Brand B: 19.8, 27.6, 30.8, 27.8, 34.1, 18.7, 16.9, 17.9 Test the null hypothesis at that the two samples come from the same population using Mann – Whitney test. [Table value: , ] where . [2013/15m/4c]
Compare the Chi-square test and Kolmogrov-Smirnov test as tests for goodness of fit. Show that the Kolmogrov-Smirnov one sample test is distribution free. Also state the large sample distribution of the Kolmogrov-Smirnov test statistic. [2012/20m/4b]
Scores of 10 candidates of Civil Service Main Examination of a recent year in Statistics Papers I and II are as under:
| Serial No. of Candidates | 1 | 2 | 3 | 4 | 5 | 6 | 7 | 8 | 9 | 10 |
| Score in Statistics I | 98 | 172 | 58 | 106 | 185 | 89 | 140 | 168 | 102 | 202 |
| Score in Statistics II | 69 | 123 | 65 | 120 | 131 | 92 | 96 | 120 | 75 | 174 |
Use sign test to verify the hypothesis that candidates in the above examination offering both the Papers of Statistics scored higher on an average in Paper I than in Paper II. [2011/12m/1d]
Let be the number of ’s those are smaller than ’s in independent random samples and . Find . [2010/12m/1f]
The following is a random sample of 10 numbers lying between : 0·22 0·90 0·96 0·78 0·66 0·18 0·73 0·58 0·11 0·97 We wish to test the hypothesis : sample comes from uniform distribution on . Explain, how you will use Kolmogorov-Smirnov test of goodness of fit for . Obtain the value of test statistic. [2010/20m/4a]
Explain run test. The following arrangement of defective (d) and non-defective (n) pieces produced in the given order by a certain machine was observed nnnnn dddd nnnnnnnnnn dd nn dddd n dd nn Test for randomness at 0.01 level of significance. (Area under standard normal curve from 0 to 2.575 is 0.495) [2006/12m/1f]
Describe Wilcoxon signed-rank test and derive the approximate distribution of the test statistic. [2006/20m/3b]
Indicate the use of Wald-Wolfowitz run test and state the test-statistic along with its mean and variance under the null hypothesis. [2005/12m/1f]
Let be i.i.d. random variables with p.d.f. having median . Show that for testing against alternatives , the sign test is uniformly most powerful. [2005/20m/4a]
Outline the Wilcoxon-Mann-Whitney test for the two-sample problem. Also, give the relevant large-sample test-statistic. [2004/12m/1f]
Discuss Wilcoxon-Mann-Whitney test and examine its consistency. [2003/20m/4b]
Discuss Wilcoxon signed rank test, and examine its consistency. [2002/20m/3c]
An unbiased coin is tossed 30 times and the following sequence of heads (H) and tails (T) is observed: HHHTTTHHTTTHHHTTHHHTTTTHHTHHT Find out the number of runs (r). Also find the mean . [2001/15m/2iv]
What are the advantages and disadvantages of non-parametric inference procedures over corresponding parametric procedures? [2001/15m/3iv]
Develop the Mann-Whitney-Wilcoxon test and obtain the mean and variance of the test statistic. How is the test carried out for large samples? [2000/12m/1f]
Let and be independent random samples from the continuous distribution functions and , respectively, where F is unknown. It is required to test . Write down the median test statistic T and its asymptotic distribution under . [2000/10m/4b(i)]
Describe Kolmogorov-Smirnov test of goodness of fit, stating necessary assumptions, for both one-sided and two-sided alternatives. [1999/30m/8b]
Explain the main difference between the parametric and non-parametric approaches to the theory of statistical inference. Specify the underlying assumptions and the null hypothesis in median, sign and U tests. [1998/25m/8a]
Describe chi-square and Kolmogorov test for goodness of fit and compare. [1998/15m/8b]
Describe the Sign test for testing the location of a probability distribution. What is its parametric counterpart? [1997/20m/8c]
Describe the Kolmogorov test for goodness of fit. Compare this test with the chi-square test for goodness of fit. [1996/20m/8b]
Obtain a confidence interval for the population median based on the sign test. [1996/20m/8c]
What is the one-sample problem concerning the location of a probability distribution? State the classical normal theory test for this problem. Describe a non-parametric version of this test and consider both one sided and two-sided alternatives. [1995/35m/8a]
If and , , are order statistics for a random sample of size n from a continuous distribution, then show that is a confidence interval for the population quantile of order p, with confidence coefficient where is the incomplete beta function. [1995/25m/8b]
2.8] Sequential analysis
27 questions
Describe sequential probability ratio test (SPRT). Find the SPRT for testing against , using random observations from Poisson . Also find the OC function for the test. [2026/15m/4c]
Let be a sequence of random variables from Bernoulli distribution with mean . Derive SPRT for testing versus . Also obtain expressions for OC function and ASN function. [2025/20m/4a]
Define Sequential Probability Ratio Test (SPRT) along with its operating characteristic function and average sample number. Determine SPRT for testing against in with and . [2023/15m/3c]
Let a random variable have exponential distribution with mean . To test against , construct sequential probability ratio test. Show that probability of terminating the test at the first stage when null hypothesis is true is , where and , , are stopping bounds. [2022/20m/2a]
Let and be two independent random variables following exponential distribution with mean and respectively, . Suppose that and are sequences of observations on and respectively. A random variable is defined as Construct Wald’s SPRT procedure based on ’s for testing versus with strength . [2021/20m/3a]
To test sequentially the hypothesis for which the distribution is given by against the alternative that is given by it is decided to continue sampling as long as where , and ’s are successive observations. Compute the probability under and that the procedure will terminate with the 2nd observation or earlier. [2020/20m/4a]
(i) For testing a simple hypothesis against simple alternative , prove that the Sequential Probability Ratio Test (SPRT) terminates with probability one. (ii) Let be random observations from the Bernoulli distribution with and . Obtain a sequential probability ratio test for against . [2018/15m/4c]
Derive the sequential probability ratio test (SPRT) for variance of a normal population when mean is known. [2016/20m/4a]
Consider observations from Poisson distribution with parameter . Develop a Sequential Probability Ratio Test (SPRT) to test against , . Obtain OC and ASN functions. [2015/15m/4c]
Prove the following results: (i) A sequential probability ratio test (SPRT) always terminates with probability one. (ii) For a SPRT with such that , then prove that [2014/15m/4b]
Let be the number of observations required by the sequential probability ratio test (SPRT) for testing against , . Stating appropriate assumptions, show that at . When , for testing against , derive the expression of the percentage saving in sample sizes under based on SPRT over the fixed sample size based MP test. Take the strength of each procedure as . [2013/20m/4a]
Comment on the validity of the statement “the S.P.R.T. terminates with probability one”. For the geometric distribution with parameter , derive the S.P.R.T. for testing against . Also obtain the O.C. function. [2012/20m/4a]
Define Wald’s SPRT of strength for a simple hypothesis against a simple alternative. Derive the SPRT procedure of strength for against , based on successive observations from , known. Indicate how the test can be carried out graphically. [2011/20m/4b]
State and prove Wald’s fundamental identity of sequential analysis. [2010/20m/3c]
Discuss how you would graphically perform the sequential probability ratio test for a simple hypothesis regarding the mean of a normal population with known standard deviation against a simple alternative. [2009/20m/2c]
Explain the difference between classical estimation and sequential estimation. Describe SPRT. [2007/12m/1d]
Describe briefly the Wald’s sequential probability ratio test. If for the choice the SPRT terminates with probability 1 and is of strength , then prove that [2006/20m/4b]
Briefly explain Wald’s SPRT. Also state its merits and disadvantages. [2005/20m/4c]
State and prove a result which shows that, compared to any other sequential test procedure, the SPRT has the least ASN. [2004/20m/4b]
If is the strength of a Sequential Probability Ratio Test with boundary points (A, B), prove that and [2002/12m/1f]
(i) Obtain the probability generating function of the Poisson distribution. (ii) Write the probability mass function of the negative binomial distribution. (iii) Define a Uniformly Most Powerful Test (UMPT). (iv) Write the expression for ASN function in sequential probability ratio test (SPRT). [2001/12m/1d]
Let be i.i.d. random variables and suppose that we want to test against . Determine the size n of the fixed sample of the most powerful test of size- and power . Determine also average sample number under . of the SPRT of the same problem with strength [2000/20m/4c]
Prove that under certain conditions, to be stated, Wald’s PRT for testing a simple hypothesis against a simple alternative terminates with probability one. [1999/30m/8a]
Consider a sequence of i.i.d variable with pdf . Derive SPRT of strength for testing against . Also obtain its OC function. [1998/20m/7c]
Consider a sequence of i.i.d. known, random variables. Derive SPRT of strength for testing against . Also obtain its OC function. [1997/20m/8b]
Let the random variable X have the pmf , and . Derive the SPR test of against [?]. Determine the OC function of the test. [1996/30m/7b]
For the SPRT with stopping bounds A and B and strength show that [1995/30m/7b]

Strengthen your GS papers
Our UPSC Mains Topic-wise & Year-wise PYQ eBook (2013–2026) maps every GS question to the syllabus, so you know what UPSC asks and how often.
View the BookDownload Free Sample« Previous: Probability | Next: Linear Inference and Multivariate Analysis »
Back to: Statistics Optional PYQs – Topic-wise | Also see: Statistics Optional year-wise question papers
Last updated: 31 October 2026