
Here are all 439 Manufacturing Science questions asked in UPSC Mechanical Engineering Optional Paper I from 1995 to 2026, arranged under the 17 topics of the official syllabus. Within each topic the latest questions come first.
Each question ends with a code such as [2024/15m/3b] – the year, the marks, the word limit (where UPSC set one) and the question number in the paper.
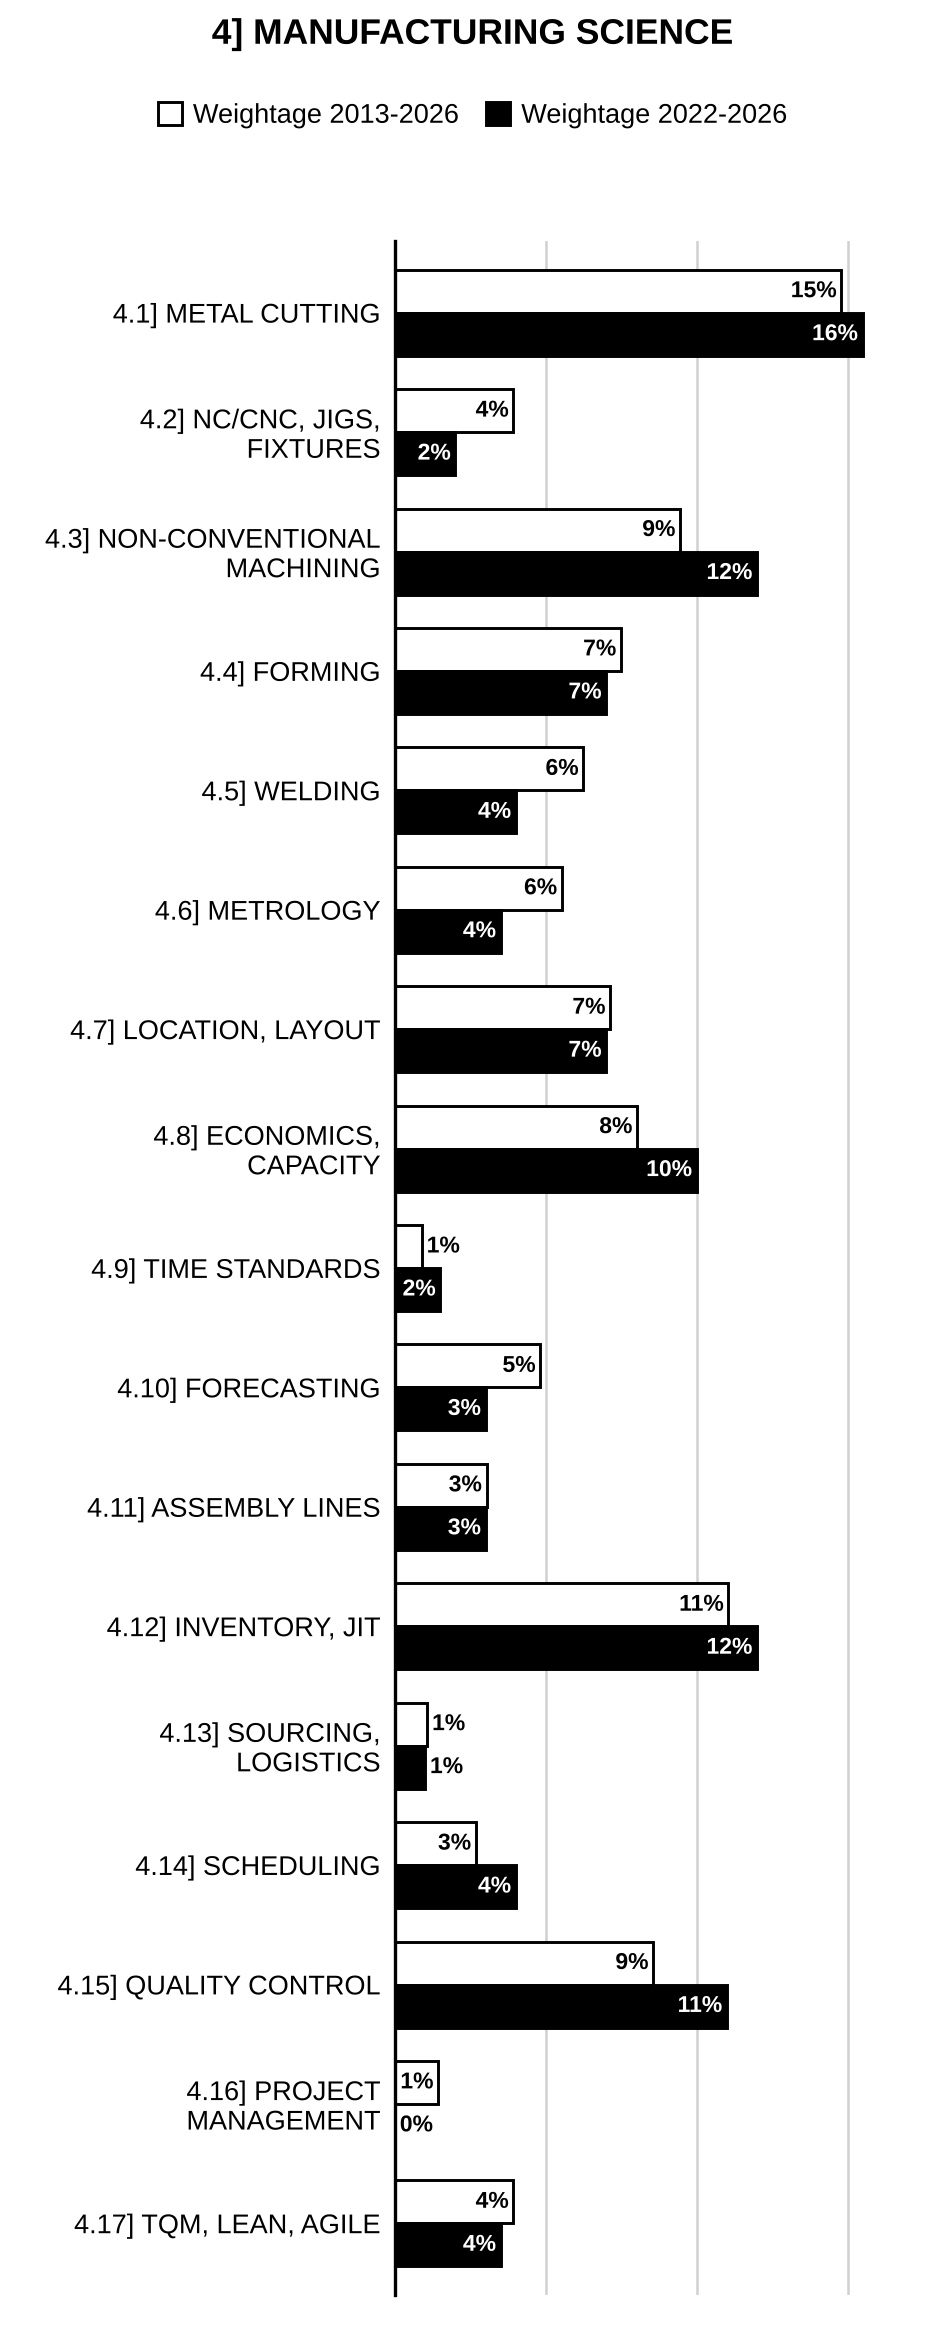
4.1] Metal cutting and machine tools
61 questions
A cylindrical workpiece of 60 mm diameter is turned down to 50 mm over a length of 120 mm on a CNC lathe with cutting speed of 120 m/min and feed of 0.3 mm/rev. Find the machining time. [2026/10m/5a]
Discuss the factors affecting surface finish in machining operations, and list the different profile finishing techniques used in modern manufacturing. [2026/10m/5e]
In an orthogonal cutting operation, the following data are obtained: Cutting force N Thrust force N Rake angle Chip thickness ratio Determine the following: (I) Shear angle () (II) Friction angle () (III) Coefficient of friction () (IV) Shear force () using Merchant’s circle relations. [2026/15m/7a(i)]
In an orthogonal machining process of medium carbon steel workpiece using HSS cutting tool with 9° rake angle, the following data were observed: Feed rate = 0.25 mm/rev Cutting speed = 250 m/min Depth of cut = 1.5 mm Chip thickness ratio = 0.30 Vertical cutting force = 1100 N Horizontal cutting force = 600 N Calculate the: (i) Shear force along the shear plane (ii) Normal force on the shear plane (iii) Friction force along the rake surface (iv) Normal force along the rake surface (v) Friction angle (vi) Work done in shear (vii) Work done in friction. [2025/20m/7a]
A cutting tool is used to machine alloy steel at cutting speed of 40 m/min. Considering the values of constants and for cutting tool material as 300 and 0.5, respectively as per tool-life equation, calculate the tool life in minutes. If the cutting speed is increased by 80%, then calculate the percentage change in tool life. [2024/10m/5a]
An orthogonal cutting of metal is performed using cutting speed of 120 m/min, tool rake angle 5° and width of cut 5 mm. Cutting produces chip thickness 0.4 mm and generates main cutting and thrust forces of 600 N and 300 N, respectively. Considering uncut chip thickness as 0.2 mm, calculate the chip thickness ratio, friction force and percentage of total cutting energy used to overcome friction at chip-tool interface. [2024/20m/7a]
Following data were observed while machining two different work materials X and Y using a centre lathe machine:
| Work Material | Cutting Tool Life (min.) | Cutting Speed (m/min.) |
| X | 20 | 125 |
| X | 15 | 150 |
| Y | 45 | 250 |
| Y | 25 | 300 |
If work material X is standard material, then determine the relative machinability considering the tool life of 50 minutes as criterion. [2023/20m/6a]
A medium carbon steel cylindrical rod is being machined under orthogonal cutting condition with an HSS cutting tool having rake angle as 12°. While machining, following data were recorded: Vertical component of cutting force = 1600 N Horizontal component of cutting force = 1250 N Chip thickness ratio = 0.25 Calculate the following for the above mentioned machining condition: (i) Normal force on the rake face (ii) Friction force along the rake face (iii) Resultant cutting force (iv) Coefficient of friction at chip tool interface (v) Normal force on the shear plane (vi) Shear force along the shear plane. [2023/20m/8b]
An HSS drill during its life can drill 150 through holes in a 10 mm thick brass plate at a drill speed of 400 rpm. Another drill of same type can make only 75 holes when the drill speed is increased to 600 rpm. How many holes will be produced by another drill of same type if its speed is raised to 800 rpm? Take the feed in all the cases as same. [2022/10m/5a]
During turning of a steel rod of 100 mm diameter, at a speed of 600 rpm, feed of 0.32 mm/rev and 3 mm depth of cut by a tool of the following geometry: inclination angle 0°, orthogonal rake angle –12°, and principal cutting edge angle () 60°, the following have been observed: Main cutting force component Radial cutting force component Chip thickness = 0.75 mm Using Merchant’s theory, determine the force along the rake surface F, force acting perpendicular to the rake surface N, coefficient of friction between the chip-tool interface, shear force and cutting power consumption. Power consumption due to feed motion may be neglected. [2022/20m/6a]
A high speed steel (HSS) cutting tool during turning of aluminium offers tool life of 3 hours at cutting speed of 60 m/minute. Determine the following using above data and assuming value of n is 0.27: (i) Life of tool if turning is performed at 80 m/minute cutting speed. (ii) Cutting speed at which cutting tool will have tool life of 2 hours. [2021/10m/5b]
Orthogonal turning of a metal is performed using single point cutting tool having rake angle of 10°. The turning operation produces chip-thickness ratio of 0.2, horizontal cutting force () of 1400 N and vertical cutting force () of 2000 N. Determine the shear plane angle, normal force, friction force on rake face and friction angle. [2021/20m/6c]
The life of a plain milling cutter of diameter 75 mm was found to decrease from 50 minutes to 30 minutes due to increase in speed of the cutter from 200 to 260 rpm while milling a cast iron plate at given feed and depth of cut. How much would be the life of that cutter if the speed is 120 rpm keeping other parameters unchanged? [2020/10m/5c]
During pure orthogonal turning of a metal rod by a tool of the following geometry it was noted that the magnitudes of the tangential component and the axial component of the cutting force are 600 N and 200 N respectively. Inclination angle = 0° Orthogonal rake = 0° Principal cutting edge angle = 90° Chip reduction coefficient = 1.732 Using Merchant’s circle diagram, determine the magnitudes of the shear force and the frictional force for the above condition. [2020/20m/6a]
For an orthogonal cutting process, the following data is given: Uncut chip thickness = 0.125 mm, Velocity = 110 m/min, Rake angle = 12°, Width of cut = 6.25 mm, Chip thickness = 0.28 mm, Cutting force = 550 N, Thrust force = 225 N Calculate the percentage of total energy that goes into overcoming friction at the tool-chip interface. [2019/10m/5a]
Two tool materials, X and Y have been selected for the machining of a workpiece. The data obtained for both the materials are shown in the table given below:
| Tool materials | Tool life (minutes) | Cutting speed (metres/minute) |
| X | 25 | 100 |
| X | 10 | 150 |
| Y | 40 | 200 |
| Y | 20 | 250 |
Estimate the relative machinability, considering material X as standard material and tool life of 50 minutes as criteria. [2019/10m/6c]
Under the orthogonal cutting operation of a workpiece of aluminum, the forces determined by the dynamometer and are 1500 N and 1000 N respectively. Rake angle of the tool is 10°. Chip thickness ratio is 0.37. Determine , , N and F using Merchant’s theory. Also determine the coefficient of friction at the chip-tool interface. (Here F is the force along the rake surface; N is the force acting perpendicular to the rake surface, is the cutting force; is the tangential force and perpendicular to ; is the shear force and is the normal component of shear force). [2019/20m/7b]
Mild steel is being machined at a cutting speed of 200 m/min with a tool of rake angle of 10°. The width of cut and uncut thickness are 2 mm and 0.2 mm, respectively. The average value of the coefficient of friction between the tool and the chip is 0.5 and shear stress () of the work material is 400 N/mm². Using Merchant’s first solution, determine: (i) Shear angle (ii) The cutting and thrust components of the machining force. [2018/20m/7a]
The machining of steel is carried out using two types of cutting tool, i.e., tool A and tool B. Data/technical parameters related with tools are given below in the table. Which tool will you prefer for 200 minutes of tool life and why?
| Tool | Value of n for tool life equation | Cutting speed for one minute tool life (m/min) |
| Tool A | 0.25 | 150 |
| Tool B | 0.30 | 180 |
[2017/10m/5c]
For orthogonal turning using a cutting tool having a rake angle of 5°, the following data is given: Chip-thickness ratio = 0.5 Rake angle = 5° Main cutting force = 1600 N Thrust force = 1300 N Calculate the shear plane angle, friction force (N), normal force (N) and coefficient of friction at chip-tool interface. [2017/20m/6a]
Draw and label the geometry of a single point cutting tool. Write a typical tool signature for a single point cutting tool along with the information which can be obtained from a tool signature. [2016/10m/5a]
For an orthogonal turning process, calculate the shear force and kinetic coefficient of friction at chip-tool interface using the following data: Chip thickness () = 0.4 mm Width of cut (b) = 2.5 mm Feed rate (f) = 0.2 mm/rev Tangential cutting force () = 1100 N Thrust force () = 290 N Cutting speed = 2.5 m/sec Rake angle = + 10°. [2016/20m/7a]
What are the different tool wear causes that are responsible for wearing of tool? Explain crater, flank and wear. [2015/10m/5a]
In an orthogonal cutting operation, the tool has a rake angle = 10°. The clip thickness before the cut = 0.5 mm and the cut yields a deformed clip thickness = 1.125 mm. Calculate (i) shear plane angle, (ii) shear strain for the operation. Derive the formulae that are to be used while finding out the shear plane angle and shear strain. [2015/20m/6a]
Compare flank wear and crater wear and draw tool life versus cutting speed curves for H.S.S., Carbide, and ceramic tools. [2014/10m/5a]
Define ‘Grinding Ratio’. Also explain what is meant by a grinding wheel acting soft or acting hard. Is it always desirable to obtain a high grinding ratio in practice? [2014/10m/5b]
What are the desirable properties while selecting a tool material for metal-cutting applications? Compare HSS and ceramic tools with regard to their application in high speed machining. [2013/15m/4b]
Determine the optimum speed, for minimum cost, for a machining operation. The data is as follows: Machine hour rate = ₹ 3,000; Cost of tool = ₹ 4,000; Machining time/job = 6 min.; Tool life = 90 min.; Taylor’s equation constants c = 100, n = 0.5; Handling time/job = 4 min.; Tool changing time = 9 min. [2013/15m/8c]
Define “tool life” and list down four methods for quantitative measurement of tool life. [2012/12m/5a]
A hole is to be drilled in a high-strength copper alloy workpiece with a 10 mm bit at a feed of 0.2 mm/rev. The spindle speed is 500 rpm. Estimate the material removal rate and the torque required for this operation. Take specific energy value of the work material as 1.9 . [2012/10m/6a(i)]
Discuss in brief the mechanism involved in grinding wheel wear. Why aluminium oxide and cubic boron nitride abrasives are suitable for grinding of steel, but silicon carbide or diamond are not? [2012/20m/6a(ii)]
Determine the optimum speed for achieving maximum production rate in a machining operation. The data is as follows: Machining time/job = 6 min. Tool life = 90 min. Taylor’s equation constants C = 100, n = 0.5 Job handling time = 4 min./job Tool changing time = 9 min. [2011/10m/6d]
In a metal cutting operation, the following equation for tool-life was obtained for H.S.S. tool: Given that: tool-life (T) = 60 min, cutting speed (V) = 40 m/min, feed (f) = 0.25 mm/rev, depth of cut (t) = 2.0 mm. Compute tool-life if speed, feed and depth of cut are together increased by 25% and also if they are increased individually by 25%. [2010/12m/5c]
Describe the properties of tungsten carbide as a cutting tool material and its applications. [2009/5m/5a(i)]
In orthogonal machining, prove that where, = chip thickness ratio, = back rake angle, = shear angle. [2009/8m/5a(ii)]
Explain ‘sudden-death mechanism’ of tool failure. [2009/4m/5a(iii)]
What are extreme-pressure lubricants? [2009/3m/5a(iv)]
Define the terms ‘rose reamer’ and ‘feed in milling’. [2009/4m/5b(i)]
Name four independent variables and three dependent variables in metal cutting. [2009/5m/5b(ii)]
With a sketch, explain the principle of working and variations of bed-type milling machine. [2009/9m/5b(iv)]
What is the fundamental mechanism of chip formation? Some major tool materials are mentioned below: 1. High-speed steel 2. Carbon steel 3. Ceramics 4. Tungsten carbides 5. Cast alloys 6. CBN 7. Single-crystal diamond. Arrange these in terms of wear resistance and toughness, Define the terms adhesion wear and diffusion wear of cutting tool. Write four material properties that affect machinability. [2008/20m/5a]
Explain the terms climb milling, gun drills, Morse taper. Sketch a plain milling cutter and indicate the rake angle, clearance angle and tooth face. What are the advantages and limitations of broaching process? Show a standard system of marking grinding wheels with a chart. [2008/30m/8a]
What do you understand by the abbreviation HSS. Twist drills are used for making holes in machine parts, label the various features of a twist drill used for making holes in mild steel. What are the tools used for finishing the holes? Make neat sketches to illustrate your answers. [2007/30m/8a]
During orthogonal machining with an HSS Tool, the rake angle was 5°, the undeformed chip thickness was 0.25 mm and width of cut was 4 mm. Assuming shear strength of work material to be and coefficient of friction to be 0.5, estimate cutting force and thrust force. [2006/20m/5a]
List various types of chips that are formed in cutting and the conditions in which they occur. [2006/20m/5b]
In drilling of 20 mm diameter hole in a mild steel solid block of 25 mm thickness, the feed used is 0.25 mm/rev. The drill must be changed after making 10 holes if it is rotated at 250 rpm. But drill can produce 50 holes if rotated at 200 rpm. How many holes can be produced if rpm is 150? [2006/30m/6a]
In an orthogonal cutting operation, the following data have been observed: Uncut chip thickness = 0.127 mm Width of cut = 6.35 mm Cutting speed = 2 m/s Rake angle = 10° Cutting force = 567 N Thrust force = 227 N Chip thickness = 0.228 mm Determine the shear angle, the friction angle, shear stress along the shear plane, and the power for the cutting operation. Also find the chip velocity, shear strain in chip, and the strain rate. [2005/20m/5a]
(i) Define tool life. What are the various ways of expressing tool life? Illustrate how wear land of a cutting tool grows with respect to machining time. (ii) A generalized Taylor’s tool life equation was obtained for H.S.S. tool, A 60 min tool life was obtained using the following cutting parameters, V = 40 m/min, , d = 2.0 mm Compute the effect on tool life if cutting speed, feed and depth of cut are increased by 25% and also if they are increased individually by 25%. Where, V = cutting speed; = feed; d = depth of cut. [2004/20m/5a]
List the criterion for tool life evaluation for HSS or ceramic tool and sintered carbide tool. Show the variables used in figures. [2003/20m/5a]
A turning tool with sharp corner and a major cutting edge angle of 60° is to be used at a feed of 0.05 mm. What minor cutting edge angle should be provided to obtain an arithmetical mean surface roughness of 3 m under ideal condition? [2003/20m/5b]
(i) For small feeds, the apparent shear strength of a material increases with decreases in undeformed chip thickness. Why? (ii) The relation between shear angle, friction angle and rake angle derived using Merchant’s theory are not in quantities agreement with experimental relationship. State the reasons. [2003/30m/6a]
During turning process with 7-α-6-6-8-30-1 mm (ASA) tool the undeformed chip thickness of 0.2 mm and width of cut of 2.5 mm were used. The side rake angle of the tool was a chosen that the machining operation could be approximated to be orthogonal cutting. The tangential cutting force and thrust force were 1177 N and 560 N respectively. Calculate (i) The side rake angle (ii) Coefficient of friction at the rake face. (iii) The dynamic shear strength of the work material. [2003/30m/6b]
(i) What is Taylor’s equation? (ii) Explain the various criteria of tool failure. (iii) What is HSS? (iv) How is surface finish measured? [2002/20m/5c]
(i) What criteria are generally used to establish tool life while turning with a single-point tool? (ii) Are tool-life criteria different for material removal consideration and surface quality consideration – if so, why? (iii) Following data refer to the output of a tool-life experiment.
| Cutting speed (meters/minute) | Tool life (minutes) |
| 60 | 16 |
| 90 | 3 |
Establish the Taylor’s tool-life equation. (iv) What is machinability of a material? What additives improve machinability? [1999/30m/6a]
(i) Distinguish between Waviness and Roughness of a machined surface. (ii) How do you define the surface finish under and systems [?]? (iii) In a turning operation following cutting conditions and tool geometry are used: Cutting speed = 20 meters/minute; Job dia = 50 mm; Feed = 0.3 mm/revolution; Depth of cut = 2 mm; Side cutting edge angle = 30°; (Approach angle = 60°); End cutting edge angle = 10°. Calculate the height of irregularities left by this operation. (iv) What do you suggest to improve the finish? (v) What is the R value in the above? [1999/30m/6b]
What is a tool life? Write Taylor’s tool life equation and explain each parameter in it. Plot a typical curve between cutting speed and tool life. A carbide tool with mild steel workpiece was found to give a life of 2 hours while cutting at 0.50 m/min. Compute the tool life if the same tool is used at a speed of 25% higher than the previous one, Also determine the value of the cutting speed if the tool is required to have a tool life of 3 hours. Assume Taylor’s exponent n to be 0.27? [1998/30m/6b]
How do you define tool life? Describe the mechanisms of tool failure. [1997/20m/200w/5c]
(i) Show with a neat sketch the forces acting on a chip in orthogonal machining. Derive an expression to calculate the coefficient of friction between tool chip interfaces. (ii) During an orthogonal machining operation on mild steel, the results obtained are: Uncut chip thickness = 0.25 mm; Chip thickness = 0.75 mm; Width of the cut = 2.5 mm; Rake angle = 0°; Horizontal cutting force = 900 N; Thrust force = 400 N. Compute the coefficient of friction between the tool and chip interface. Determine also the ultimate shear stress of the work material. [1997/40m/7a]
Discuss the possible modes of failure of a cutting tool. For a lathe tool, show the flank and crater wears. [1996/20m/200w/5c]
What is form stability of a cutting tool? Discuss the properties required for an ideal cutting tool material. [1995/20m/200w/5b]
Explain the meaning of cutting tool failure and discuss its modes and causes. [1995/30m/8b]
4.2] NC and CNC machining; jigs and fixtures
33 questions
What are the various computer languages used for NC machines? Explain the merits and limitations of each language. [2025/10m/8a]
The stepper motor of a point-to-point controlled NC machine has specification sensitivity of 3°/pulse. The pitch of the lead screw is 2.4 mm. Determine the expected positioning accuracy. [2024/10m/5b]
Explain ‘Coordinate system’ and ‘Motion control’ with reference to NC machines. [2021/20m/8c]
Explain the difference between NC and CNC machines mentioning the benefits of CNC machines over NC machines. [2018/10m/5c]
Describe different types of control systems possible for CNC operations along with respective applications using suitable schematic. [2017/20m/8c]
Briefly explain the different types of jigs. What do you understand by intermediate jig concept? [2015/10m/6c]
Discuss the advantages and limitations of NC manufacturing process. Also enlist the advantages of CNC manufacturing over NC manufacturing process. [2015/10m/8c]
Differentiate between open loop, closed loop and adaptive control systems used in NC machine tools. [2014/10m/5e]
An open loop type NC machine has a stepper motor with a step of 0.9 degree. The lead screw of the machine is of 4 mm pitch. (i) If the tool has to be moved by 2.87 mm, how many pulses will have to be fed? (ii) If the motor is rotating at 15 r.p.m., what is the pulse frequency and the feed rate of the machining operation? [2013/10m/6a]
(i) With the help of an example, clarify the function of a clamp in a fixture. (ii) Sketch a cam type clamp and suggest its two applications. [2012/12m/5b]
In the above figure define the lines , , and in the APT language.
[Figure: (printed above the text of 8(c)) – x–y axes; two equal circles (left) and (right) side by side at the same height; is a horizontal line tangent to the tops of both circles and a horizontal line tangent to the bottoms of both circles; and are the two inclined cross (internal) tangents of the circles, crossing each other midway between the circles: comes down from the upper left, touches near its top, passes between the circles and touches near its bottom, continuing to the lower right; rises from the lower left, touches near its bottom and near its top, continuing to the upper right; no dimensions are given] [2012/10m/8c]
Explain, at least two, characteristics each of NC, CNC and DNC. [2011/10m/6b]
In an NC drilling operation, the tool tip is at a location (–100, 0, 100). The datum (0, 0, 0) is left hand lower corner on top surface of the workpiece, which is rectangular (300 mm × 300 mm × 15 mm thick). A thru’ hole of 10 mm diameter is to be drilled in the centre of the workpiece. Using only rapid positioning and linear interpolation functions, write the program blocks, in absolute mode. Assume permitted cutting speed = 32 m/min and feed rate = 150 mm/min. [2011/10m/7c]
Illustrate with the help of neat sketches the differences between open-loop and closed-loop control in NC system. Why is feedback not possible in open-loop control system? [2010/22m/7a(i)]
In open-loop NC system the shaft of a stepping motor is connected directly to the lead screw x-axis of the machine table. The pitch of the lead screw is 3.0 mm. The number of step angles on the stepping motor is 200. Determine how closely the position of the table can be controlled, assuming that there are no mechanical errors in the positioning system. Also, what is the required frequency of the pulse train and the corresponding rotational speed of the stepping motor in order to drive the table at a travel rate of 100 mm/min? [2010/8m/7a(ii)]
What is the function of stepper motor? [2009/2m/5b(iii)]
With a figure, explain ‘3-2-1’ method of location. [2009/10m/8b(i)]
Draw leaf jig and mention its advantages. [2009/10m/8b(ii)]
Write six advantages of programmable machine tools. Define incremental and absolute system used in NC systems. Discuss the terms roughness, waviness, cutoff and flaws in surface texture measurement. What is the function of machine control unit in NC machines? [2008/20m/5b]
What is 3-2-1 principle of location? What are the various degrees of freedom for a body in space? Distinguish between a Jig and a Fixture. [2007/20m/5a]
Differentiate between point-to-point and continuous path control systems used in NC machines. What are their respective areas of application? [2005/15m/6b]
Illustrate the uses of the following preparatory functions: G01, G02 and G03. [2005/15m/6c]
What is the function of a clamp? Describe the design and operational factors to be considered for proper and adequate clamping of a workpiece. [2005/20m/8b]
Define automation. What are the features of flexible automation? Illustrate with neat sketches two configurations of automated flow lines of production. [2004/20m/5b]
What are the three basic components of NC system? Explain the principle of operation of NC system with the help of a neat sketch. Why it is essential to provide co-ordinate system in NC? What is the difference between fixed zero and floating zero co-ordinate system? [2004/20m/6a(i)]
A part program is to be written to drill the holes in the work part shown below. The part is 25 mm thick. The diameter of drill is 20 mm.
[Figure: Rectangular plate 10.00 wide × 5.00 high (dimensions in cm) with five hole centres marked “+”. Horizontal dimension chain from the left edge: 1.5, 2.5, 2.0, 1.0 (i.e. x = 1.5, 4.0, 6.0, 7.0). Vertical dimension chain from the bottom edge: 1.5, 1.5, 1.0 (i.e. y = 1.5, 3.0, 4.0). Holes at (x, y) = (1.5, 4.0), (4.0, 4.0), (7.0, 4.0), (6.0, 3.0) and (1.5, 1.5). Note under the figure: “Dimensions are in cm.”]
(1) Define the x and y axes for the job. (2) Write manual part programming using word address format and an absolute position system. The speed and feed are manually set by the operator. [2004/10m/6a(ii)]
This program drills two holes using a CNC machining center. Indicate the meaning of the following commands.
| PROGRAM | ϕ0001 | |
| N005 | G54 | G90 S499M03 |
| N010 | G00 | X1. Y1. |
| N015 | G43 | H01 Z.0 M08 |
| N020 | G01 | Z-1.25 F3.5 |
| N025 | G00 | Z.1 |
| N030 | X2 | |
| N035 | G01 | Z-1.25 |
| N040 | G00 | Z.1 M09 |
| N045 | G91 | G28 Z0 |
| N050 | M30 |
Note: ϕ indicates letter O and 0 indicates numeral zero. [2002/20m/5b]
(i) Explain the difference between the following two types of motion controls used in CNC machines (a) Point to point or position control (b) Contouring or continuous path control Give an example each of their application. (ii) A stepper motor is used in a CNC positioning system, for driving the table through a lead screw of pitch = 3 mm. The control resolution for the table movement is specified as 0.01 mm. Determine (a) The number of pulses which the motor should give per revolution (b) The size of step angle of the motor. (c) The linear travel rate of the table. The motor works at a pulse rate of 200/s. [2001/20m/6a]
With the help of sketches, show the degrees of freedom. a work-piece in space possesses and how nine degrees of these freedoms can be restricted with the help of 6 pins. How are the remaining three degrees of freedom restricted when holding the work-piece for machining? [2000/30m/6b]
How many degrees of freedom are there for a solid body? For proper location, how many locators are needed for restraining these freedoms? What general design considerations you advocate for proper location without redundancy? What are diamond locators and where they are used? [1999/20m/200w/5d]
Describe with the help of a block diagram the principal components of a typical CNC system. Explain how three different functions like data input, computation and sequence control of a CNC system are integrated. [1998/30m/6a]
State basic principle of operation of CNC machine tools. Describe the essentials of control system used in position (point to point) and path control of the tool with respect to the work piece. [1997/30m/8b]
Justify the use of jigs and fixtures in large batch production. Briefly discuss the design of a jig required for drilling a hole of 5 mm in the centre of a 10 mm thick M.S. plate of size 100 x 100 mm. [1996/20m/7b]
4.3] Non-conventional machining
39 questions
A laser beam delivers 5 J of energy in 0.01 sec over an area of . Calculate the power density of the laser beam. [2026/10m/5c]
A biomedical implant requires excellent surface integrity with no thermal damage. From the perspective of non-conventional machining, discuss the following: (i) Suitability of USM, LBM, EDM for biomedical implant machining (ii) Surface defects in each process (iii) Best process selection with justification (iv) Post-processing requirements of the selected process. [2026/20m/6b]
An electro-discharge machining process is used for cutting a 6 mm deep cavity in a high carbon steel workpiece using the following: (I) Copper-tungsten electrode, and (II) Copper electrode. Assuming the wear ratio for copper-tungsten electrode as 9 : 1 and for copper electrode as 3 : 1, determine the required spindle movement for cutting this cavity. [2025/10m/6a(ii)]
A long hole having 15 mm diameter and 125 mm depth is required to be drilled in high carbon steel using electro-chemical machining process. Calculate the time required to drill this hole if the supplied current magnitude is 45 Amp and electrolyte used is 15% NaCl. Consider that the valency of iron is 2, atomic weight of iron is 56 and density of steel is . [2025/10m/6b(i)]
An electro-chemical machining process is used for machining of Nimonic 75 alloy. The composition (% by weight) of Nimonic 75 alloy is given here:
| Ni | Cr | Fe | Si | Mn | Cu | Ti |
| 72.5 | 19.5 | 5.0 | 1.0 | 1.0 | 0.6 | 0.4 |
Consider the following data:
| Metal | Gram atomic weight | Valency of dissolution | Density |
| Nickel | 58.71 | 2/3 | 8.90 |
| Chromium | 51.99 | 2/3/6 | 7.19 |
| Iron | 55.85 | 2/3 | 7.86 |
| Silicon | 28.09 | 4 | 2.33 |
| Manganese | 54.94 | 2/4/6/7 | 7.43 |
| Copper | 63.57 | 1/2 | 8.96 |
| Titanium | 47.9 | 3/4 | 4.51 |
Using the lowest valency of dissolution for each element, determine the material removal rate, when a current of 1050 Amp is applied. [2025/10m/6b(ii)]
Explain the principle of electric discharge machining (EDM) using suitable diagram. Describe the effect of process parameters of electric discharge machining on process performance characteristics such as material removal rate, tolerance and surface characteristics. [2024/20m/8a]
In an electrochemical machining process of an iron surface using sodium chloride solution as electrolyte, following observations were made: Specific resistance of the electrolyte = 5 Ω cm (ohm-cm) Supply voltage = 15 V DC Cross-sectional area of iron surface = 20 mm × 20 mm Gap between the tool and workpiece = 0.3 mm Use the following data for iron: Valency = 2, Atomic weight = 55.85, and Density = Consider the current efficiency as 100% and Faraday’s constant = 96540 Coulombs. Calculate the material removal rate and electrode feed rate in the above mentioned electrochemical machining process. [2023/10m/5a]
A laser beam with power intensity of falls on a stainless steel sheet. Find out the time required for the stainless steel surface to reach melting temperature, assuming that only 10% of the beam power is absorbed. Use: Thermal conductivity = 0.27 W/cm-°C Volume specific heat = -°C Melting point temperature = 1455°C. [2023/10m/5b]
Discuss the mechanism of material removal in ultrasonic machining. [2022/10m/8a(i)]
What are the different parameters affecting the material removal rate in ultrasonic machining? Show the variation of material removal rate with respect to these parameters using suitable schematic. [2022/10m/8a(ii)]
The frontal working area of the electrode is in a certain ECM operation in which the applied current = 1800 amps and the voltage = 12 volts. The material being cut is nickel (Valency = 2), whose specific removal rate is . (i) If the process is 90% efficient, determine the rate of material removal in . (ii) If the resistivity of the electrolyte is 140 ohm-mm, determine the working gap. [2021/15m/8a]
Determine the percentage change in the machining time for a USM (Ultrasonic Machining) operation cutting WC plates when the tool material is changed from copper to stainless steel. [2020/20m/8b]
Write the effect of various machining parameters on Material Removal Rate (MRR) in the case of Ultrasonic Machining (USM). [2019/10m/5d]
During an electric discharge drilling of a 10 mm square hole in a low carbon steel plate of 6 mm thickness, brass tool and kerosene are used. The resistance and capacitance in the relaxation circuit are 50 Ω and 10 μF, respectively. The supply voltage is 200 V and the gap is maintained at such a value that the discharge (sparking) takes place at 150 V. Estimate the time required to complete the drilling operation. Approximate relationship between material removal rate (Q) and power (W) for steel material is given by: [2018/10m/5a]
Electrochemical machining of 400 mm² surface of iron is performed using supply voltage of 15 V and tool-workpiece gap of 0.3 mm. Considering gap resistance for the flow of current through electrolyte to be 0.0015 Ω, calculate the metal removal rate, MRR (m³/s). The relevant data for iron are the following: Valency = 2 Atomic weight = 55.85 Density = 7860 kg/m³ Faraday’s constant = 96540 coulombs. [2017/10m/5a]
Explain the principle of abrasive waterjet machining using suitable schematic. Write the advantages and applications of abrasive waterjet machining. [2017/15m/6c]
Calculate the current required for electrochemical machining of pure iron so as to achieve a metal removal rate of . Consider: Faraday’s constant (F) = 96,500 Coulombs Atomic weight of iron = 56 Valency of iron = 2 Density of iron = 7.8 [2016/10m/6a]
With the help of a neat schematic sketch explain the electrochemical machining process. Also discuss its applications. [2015/20m/8b]
Explain with the help of a sketch the Electric Discharge Machining (EDM) process. What are its advantages and limitations? Describe the nature of the surface obtained by EDM. Also name any three important electrode materials. [2014/20m/6b]
What is the principle of LBM (Laser Beam Machining)? Draw a sketch and name the salient elements used in LBM. [2013/15m/8b]
Explain in brief, with sketches, the pressure and vacuum gap flushing techniques used in EDM. [2012/10m/6b(i)]
Which one of the above will result in a more accurate cavity? Give reason. [2012/5m/6b(ii)]
Also discuss how the gap flushing conditions may be improved while drilling small holes. [2012/5m/6b(iii)]
State the mechanism of cutting by abrasive jet. What are the advantages and disadvantages of AJM? Mention two applications. [2011/10m/5e]
What is the principle of electro-chemical machining (ECM)? What are the advantages and disadvantages of ECM over conventional drilling? Comment on the surface finish and the accuracy of the ECM. [2011/20m/8b]
Describe the applications of abrasive-jet machining. [2009/5m/8a(i)]
What are the differences between electrolyte and dielectric? [2009/5m/8a(ii)]
What is wire EDM process? Explain the reasons for its popularity. [2009/10m/8a(iii)]
Sketch four methods for the manufacture of a pipe. A double-action press for deep drawing a cup is good. Why? Name some advantages of ECM and explain why the gap between electrode and the workpiece is so important in ECM. Name applications and advantages of water-jet cutting. [2008/30m/6b]
What is ultrasonic machining? Draw a neat sketch showing the important parts of an ultrasonic machine, label the parts. Which materials are normally machined using ultrasonic machining? [2007/20m/5b]
Prove that in EDM, using resistance-capacitance relaxation circuit with a constant DC source, for maximum power delivery, the discharge voltage should be 72% of supply voltage. How is the MRR affected by variation in resistance, mean current, capacitance and spark gap? [2006/30m/6b]
With a neat sketch, explain the working of ECM machine. How the machining rate is influenced by (i) rate of electrolytic flow, (ii) temperature of electrolyte, and (iii) applied voltage? What are the main applications of the process? [2005/30m/6a]
Illustrated by the simplified diagram explain the principle of electrical-discharge-machining process. What are the dielectric fluids commonly used in EDM? How metal removal rate can be controlled? Discuss briefly about the application of EDM. [2004/30m/6b]
Explain with a neat sketch the salient features of Ultrasonic drilling (USD) covering (i) the basic operating principle (ii) mechanism of metal removal (iii) applications. [2001/20m/5b]
What are the advantages of laser beam machining in respect of the following Material removal mechanism, energy source, Energy transfer media, potential, current, power, gap and applications. [2000/15m/6a(i)]
Name any five electrodes (tools) materials used in EDM (Electric Discharge Machining). Give the advantages and disadvantages of graphite as a tool material. Also define flushing and state its purpose. Describe with sketches the various types of flushing used in EDM. [2000/30m/8b]
What is the principle behind electrical discharge machining (EDM)? Discuss briefly the process indicating voltage, current and temperature as well as its advantages and limitations. Why is proper flushing so important in this process? Suggest the required spindle movement for cutting a 5 mm cavity in steel by EDM process using (i) copper electrode and (ii) copper-tungsten electrode. Assume the wear ratio for copper electrode as 2 : 1 and for copper-tungsten electrode as 8 : 1. [1998/30m/7a]
Explain the mechanism of electric discharge machining. What is wire cut EDM? Indicate its special application. What are the basic requirements of a dielectric fluid? [1996/30m/6a]
Explain with the help of a suitable sketch the working principle of a typical pulsed ruby laser machining system. [1995/20m/200w/5d]
4.4] Forming processes
39 questions
A strip of width 250 mm is reduced from 30 mm to 20 mm thickness in a rolling mill of roll radius 400 mm. Considering coefficient of friction 0.25 and average flow stress 300 MPa, find the following: (i) Contact length (ii) Rolling force (iii) Check if the biting condition is satisfied. [2026/10m/6a]
A low carbon steel stock of thickness 25 mm is to be rolled in two stages. In the first stage, the reduction is to be from 25 mm to 15 mm and in the second stage from 15 mm to 5 mm. Determine the minimum diameter of the rolls for the two stages if the maximum angle of bite is 35° for the first stage and 25° for the second stage. Also, calculate the required coefficient of friction in both the stages. [2025/10m/5a]
A perfectly plastic material having yield strength of 300 MPa is subjected to extrusion at 400 °C. The extrusion speed is 300 mm/s. The extrusion process is done on billet of diameter 50 mm and length 300 mm. Extrusion reduces the diameter of billet from 50 mm to 20 mm. Assuming that the extrusion process is frictionless, determine the true strain, average true strain, ideal extrusion force and work done on billet during extrusion. The initial diameter of billet is significantly greater than the final diameter after extrusion. [2024/20m/6a]
A tube is to be drawn as per the dimensions given in the following Figure 7(a)(i) showing die, plug and tube. Assuming the metal in work hardened condition with yield stress , coefficient of friction for die as well as for plug is 0.15, calculate the drawing load and power of the motor required for drawing the tube with the speed of drawing 0.50 m/s.
[Figure: Figure 7(a)(i) – Tube drawing through a die with a plug (all dimensions in mm), drawing direction to the left (arrow). Incoming tube (right): outside diameter φ 20 mm, wall thickness 2.0; drawn tube (left): outside diameter φ 18 mm, wall thickness 1.5. Die semi-angle 15° (outer surface) and plug semi-angle 10° (inner surface); die shown as a hatched plate across the tube, tube marked “Tube”] [2023/10m/7a(i)]
State the sequence and purpose of different types of rolling passes, used for rolling flats and plates. [2022/5m/6b(i)]
A steel plate of 200 mm width and 30 mm thickness is rolled using two-stand rolling mill where diameter of each roller is 400 mm. Rolling is performed at 60 rev/min of roll speed to reduce thickness of steel strip from 30 mm to 26 mm. Average flow stress of metal during rolling is expressed by where n = strain hardening coefficient K = strength coefficient, MPa = true strain Consider strength coefficient of metal (K) is 300 MPa and strain hardening coefficient (n) is 0.2 and coefficient of friction between strip and roll during rolling is 0.15. Calculate: (I) Draft in mm (II) Maximum achievable draft for above condition of rolling in mm (III) Average flow stress in MPa (IV) Rolling force in Newton (Neglect all other possibilities related to rolling) [2022/15m/6b(ii)]
In a case of open die forging, derive the expression for determining forging force per unit length for forging a flat strip between two parallel dies. Also, state the assumptions made while deriving the above mentioned expression. [2021/20m/7c]
What do you understand by the term ‘flash’ in a forging? Explain with the help of a sketch. [2020/10m/5a]
A steel wire is drawn from an initial diameter of 12.7 mm to a final diameter of 10.2 mm at a speed of 90 m/min. The half-cone angle of the die is 6° and the coefficient of friction at the job-die interface is 0.1. A tensile test on the original steel specimen gives a tensile yield stress of 207 N/mm. A similar specimen shows a tensile yield stress of 414 N/mm at a strain of 0.5. Assuming a linear stress-strain relationship for the material, determine the drawing power and the maximum possible reduction with the same die. No back tension is applied. [2020/20m/7b]
A tube of 18 mm outside diameter and 1.6 mm wall thickness is to be drawn to an outside diameter of 12 mm and wall thickness of 1 mm using a plug. Calculate the drawing load, given that coefficient of friction for die = 0.16 and for the plug = 0.2. The die angle is 30° and the plug angle is 20°. The metal is in fully work hardened condition with a yield stress of 1.4 kN/mm. Also find the power rating of the motor if the drawing speed is 0.6 m/sec. [2019/20m/7a]
What is meant by “draft” in relation to rolling process? Determine the maximum possible reduction for cold-rolling a 400 mm thick slab, when and the roll diameter is 700 mm. Briefly describe the methods of reducing the roll force by giving suitable explanation. [2018/5m/5e(i)]
What is the difference between open-die and impression-die forging? What is barreling in relation to forging? How can it be minimized? How does barreling occur in upsetting of a hot work piece between cold dies and how can it be minimized? Explain the role of flash in impression-die forging. [2018/5m/5e(ii)]
What do you mean by extrusion of metals? What are some of the attractive features of this process? What is the primary shape limitation of the extrusion process? Differentiate between direct and indirect extrusion with the help of neatly labelled sketches. What is the primary benefit of indirect extrusion? Briefly describe the three principal extrusion defects. [2018/15m/8c]
An annealed copper plate of 300 mm width and 20 mm thickness is rolled to 16 mm thickness in one pass. Considering radius of the roller as 400 mm, rotational speed of 80 r.p.m. and average flow stress during rolling as 400 MPa, calculate the true strain and rolling force (kN). [2017/10m/5b]
List five distinct methods used to obtain high energy rates in HERF. With the help of a sketch explain the spark discharge method of High Energy Rate Forming. Also mention two advantages and three important applications of HERF method. [2014/20m/7a]
A cup, of 50 mm diameter and 100 mm height, is to be drawn from low carbon steel sheet. Neglecting the influence of thickness and corner radii: (i) calculate the blank diameter (ii) decide whether it can be drawn in a single draw, if maximum reduction permitted is 40%. [2013/10m/5d]
How is the domestic kitchen gas cylinder manufactured? State the raw material, its shape and the processes involved. [2013/10m/7b]
What is the significance of (1) angle of nip, and (2) angle of bite during rolling operation? How are they related to roll friction? [2012/10m/8a(i)]
Classify the process of extrusion with the help of sketches. Enumerate the conditions under which central burst may occur. Where does a ‘pipe’ occur? [2012/15m/8a(ii)]
What is “friction hill”? [2012/5m/8a(iii)]
For punching a 10 mm circular hole, and cutting a rectangular blank of 50 × 200 mm from a sheet of 1 mm thickness (mild steel, shear stress = 240 ), calculate, in each case: (i) Size of punch (ii) Size of die (iii) Force required. [2011/10m/5a]
Sketch a mould for two hollow components to be cast. On the diagram, indicate runner, gate, riser, core, cope, sprue, pouring basin, sprue well, drag, parting line. [2011/10m/5c]
Compare Smith forging, drop forging, press forging and upset forging. Mention three points for each. [2011/10m/6c]
How are metal tooth-paste tubes made commercially? Draw the tools configuration with the help of a neat sketch. [2010/30m/6b]
Write the differences between coining and embossing. [2009/4m/7a(iv)]
What are the advantages of isothermal forging? [2009/3m/7a(v)]
What is the difference between extrusion and drawing? [2009/3m/7a(vi)]
Sketch four methods for the manufacture of a pipe. A double-action press for deep drawing a cup is good. Why? Name some advantages of ECM and explain why the gap between electrode and the workpiece is so important in ECM. Name applications and advantages of water-jet cutting. [2008/30m/6b]
Derive an equation for the average die pressure in open die forging of a circular disc. Explain the assumptions made in deriving the equation. The solution may be found only for the sliding condition of friction. [2007/30m/6b]
What is friction hill in rolling process? State the condition of skidding in rolling. How does the roll pressure change with (i) front tension and back tension, and (ii) the roll diameter? [2006/20m/8a]
With the help of a neat sketch, explain the electro-hydraulic forming process for making tubular parts and list the variables governing the process. What are the main applications of this process? [2005/20m/5b]
What is a three high rolling mill? Show the direction of motion of rolls and the workpiece on a neat sketch of three high rolling mill. What lubricants are used during hot rolling? What is camber? Explain in relation to rolling process the function of providing camber. [2002/30m/6a]
(i) List three high energy rate forming processes. (ii) What are the important reasons behind the use of these processes? (iii) Explain in detail, using a diagram the process of explosive forming of a spherical dome with a flange from sheet steel. [2001/30m/6b]
Define the following terms in rolling (i) bite angle (ii) percentage reduction in thickness (iii) elongation coefficient (iv) neutral point (v) forward slip. A slab of 300 mm initial thickness, 600 mm wide is given a reduction of 50 mm in a rolling mill with rolls 1000 mm diameter. The spread in this pass is 5 mm. Calculate the values of the bite angle, percentage reduction in thickness and elongation coefficient. How is forward slip determined experimentally? [2001/40m/7a]
What is high energy rate forming? Discuss the theory of high energy metal forming. What are the advantages and limitations of high velocity forming? [2000/15m/6a(ii)]
Describe with a neat sketch the principle of explosive forming of sheet metal. Give examples of two components that are manufactured by high energy rate forming. [1997/30m/8a]
Draw a sketch of the rolling operation for a strip and indicate the forces and stresses during rolling. Discuss the aspects of friction and velocity during the process. [1996/20m/200w/5b]
Determine the workload and frictional power loss for simple forward extrusion with a flat face die. [1995/30m/7a]
Figure given below illustrates various types of common deep drawing defects. Name the defects and the probable reasons for their development.
[Figure: Six unlabelled sketches of defective deep-drawn parts in two rows. Top row: (1) a square box-shaped part with a torn/folded corner and streaked walls; (2) a small cylindrical cup with a wavy (eared) rim and vertical streaks on the wall; (3) a cup with a wide flange. Bottom row: (4) a shallow flanged cup; (5) a cylindrical cup with vertical marks on the wall; (6) a flanged cup with a wavy flange and marked walls] [1995/30m/7b]
4.5] Welding processes
23 questions
In an arc welding process of steel with a potential of 15 volt, current of 150 Amp and travel speed is 5 mm/sec, the cross-sectional area of joint is observed as . If heat required to melt the steel is and heat transfer efficiency is 0.75, then calculate the melting efficiency. [2025/10m/5b]
If the power source characteristic in a Metal Inert Arc welding process is , and the arc characteristic is , where and is voltage, I is current and is arc length in mm. Calculate the change in power of the arc if the arc length is changed from 1 mm to 3 mm. If the maximum current capacity of the power source is 300 Amps, then determine the maximum arc length that can be sustained. [2025/10m/6a(i)]
Write the functions of coating on Shielded Metal Arc Welding (SMAW) electrode. [2022/10m/5b]
Spot welding of two steel sheets each of 1 mm thickness is performed using 20,000 A welding current supplied for 0.15 seconds. Assume that: (i) interface contact resistance is 200 micro-ohms, (ii) heat required for melting unit volume of steel is , and (iii) only 60% of heat generated is used for melting of metal at the interface. Calculate: (I) Heat generated, J (II) Volume of the weld nugget, [2022/10m/7c]
TIG welding of two sheets of 5 mm thickness is performed using welding current (I) of 200 A and arc voltage (V) of 12 V. Assume 70% of generated arc heat is utilised for melting of base metals. If the steel being welded needs heat for melting, then determine the following: (i) Power of welding arc (W) (ii) Rate at which energy is delivered for melting (W) (iii) Volume rate () at which weld metal is produced. [2021/10m/5a]
Explain the process of metal transfer in gas metal arc welding process with neat sketches. [2020/10m/6c]
The voltage – length characteristics of a direct current arc is given by Volts, where is the length of the arc in cm. The power source characteristic is approximated by a straight line with an open circuit voltage = 80 V and short circuit current = 1000 amp. Determine the optimum arc length and corresponding power. [2019/20m/8a]
Melting efficiency in case of an arc welding of steel is given as 30%. The travel speed is 5 mm/sec and the cross-sectional area of the joint is 20 mm². Heat required to melt steel may be taken as 10 J/mm³ and heat transfer efficiency as 85%. Find out the current drawn by the machine, if voltage potential is 20 V. [2018/15m/6c]
Two aluminium plates are welded using tungsten inert gas (TIG) welding process with the help of welding current 150 A, arc voltage 12 V and arc travel speed 2 mm/s. Considering heat transfer efficiency of TIG welding process as 90% and heat required for melting unit volume of metal (Al) as 15 J/mm³, calculate the melting efficiency of the process if the cross-sectional area of the weld joint is 20 mm². [2017/15m/6b]
The volume of a weld nugget produced by spot welding process is . Welding is performed using 10000 A current. Energy required for melting of unit volume of metal is . Assume that heat lost to the surrounding base metal is 500 J and contact resistance is 0.0002 ohms. Calculate the (i) time (in sec) for which the welding current is supplied, and (ii) thermal efficiency of the spot welding process if other heat losses are negligible. [2016/10m/8a]
How is plasma arc welding different from tungsten inert gas welding (TIG)? Why is plasma arc welding associated with higher temperatures? With the help of neat sketches, explain transferred and non-transferred plasma arc welding. [2015/20m/6b]
Explain with neat sketches the Plasma Arc Welding (PAW) process and discuss its applications and limitations. [2014/20m/6c]
Sketch the set-up for spot welding showing details of power input and electrodes: (i) Draw the force/time and current/time diagrams. (ii) Explain how heating takes place. (iii) Indicate order of magnitude of current, voltage and time. (iv) How projection welding is different from spot welding? [2013/10m/6c]
How is the domestic kitchen gas cylinder manufactured? State the raw material, its shape and the processes involved. [2013/10m/7b]
Compare the process capabilities of Shielded Metal-Arc Welding (SMAW) and Submerged Arc Welding (SAW) processes. [2012/15m/7b(i)]
How thick jobs (> 20 mm) may be welded by SMAW process? [2012/5m/7b(ii)]
Draw a self explanatory sketch of oxy-acetylene gas cutting torch. Briefly explain how cutting is effected. [2011/20m/7b]
What are the various five fuel gases used for gas welding? Give their chemical composition, formula and specific heat content. Indicate also the maximum temperature reached in the respective flames. What percentage of oxygen is supplied by the torch in any one of the fuel gases? Give the chemical reactions in the various zones of the neutral flame. [2010/30m/6a]
Name the various alloying elements used with tungsten for GTAW. Give the approximate content of any two used in GTAW process. Enumerate applications of GTAW process. [2009/4m/7a(i)]
Define the term ‘keyholing’ used in laser welding. [2009/3m/7a(ii)]
What is ‘dip transfer’ in GMAW? [2009/3m/7a(iii)]
What are the advantages and disadvantages of d.c. welding machine? What happens during the hold time of a spot weld? Why is the slop control so important in spot welding aluminum? When would you choose gas welding over arc welding? What do explosive welding and diffusion bonding have in common? [2008/30m/6a]
What is the difference between laser welding and plasma welding? Draw a neat sketch of a plasma torch, label the various parts. [2007/30m/6a]
4.6] Metrology
34 questions
A hole is specified as mm. Using Taylor’s principle, determine the following: (I) GO gauge size (II) NO-GO gauge size Assume: (A) Gauge tolerance = 10% of work tolerance (B) Wear allowance = 10% (only GO gauge) [2026/5m/7a(ii)]
A shaft of nominal size 60 mm is to be fitted into a hole. The tolerances are: Hole tolerance – 0.030 mm Shaft tolerance – 0.020 mm Minimum clearance required – 0.010 mm Determine the following: (i) Maximum clearance (ii) Hole and shaft limits (iii) Allowance. [2026/10m/8a]
For the given dimensions of mated parts, determine the values of allowance, hole tolerance and shaft tolerance using the basic hole system. Hole: 57.50 mm, 57.52 mm Shaft: 57.47 mm, 57.45 mm. [2025/10m/5e]
Draw and label the surface roughness symbol, if the method of machining was milling, sample length 3.0 mm, direction of lay is perpendicular to the surface, machining allowance is 2 mm with roughness as 6.3 μm. Also, calculate the centre line average and root mean square values of surface roughness for the following measurements {figure 7(a)(ii)} taken over a sample length of 20 mm.
[Figure: Figure 7(a)(ii) – Surface profile trace over a sample length of 20 mm (vertical axis in μm) with eight marked ordinates, numbered 1 to 8, alternately peaks and valleys: 1 = 70, 2 = 35, 3 = 75, 4 = 20, 5 = 65, 6 = 40, 7 = 80, 8 = 50] [2023/10m/7a(ii)]
A mechanic needs a gauge for checking the diameter of holes to be machined to a diameter of mm. What should be the dimensions of the gauge, if unilateral system of tolerances are incorporated? Assume gauge tolerance and wear allowance each as 10% of work tolerance. [2021/10m/5e]
A hole and shaft have a basic size of 25 mm and are to have a clearance fit with maximum clearance of 0.02 mm and a minimum clearance of 0.01 mm. The hole tolerance is to be 1.5 times the shaft tolerance. Determine limits for both hole and shaft (i) using a hole basis system. (ii) using a shaft basis system. [2020/10m/5b]
A hole and shaft have a basic size of 25 mm and are to have a clearance fit with maximum clearance of 0.02 mm and a minimum clearance of 0.01 mm. The hole tolerance is to be 1.5 times of the shaft tolerance. Determine the limits for both hole and shaft (i) using hole basis system and (ii) using shaft basis system. [2019/10m/8c]
Explain the concept of clearance, interference and transition fit. How are fits represented in drawings? [2018/15m/7b]
The following limits are specified to give a clearance fit between a shaft and a hole in a limit system: Calculate the following: (i) Basic size (ii) Shaft and hole tolerances (iii) Shaft and hole limits (iv) Maximum and minimum clearances. [2017/15m/7a]
Differentiate between Tolerance and Allowance. [2016/10m/5b]
A 20 mm diameter shaft and bearing are to be assembled with a clearance fit. The tolerance and allowances are as under: Allowance = 0.002 mm Tolerance on hole = 0.005 mm Tolerance on shaft = 0.003 mm Find the limits of size for the hole and shaft, if (i) the hole basis system is used, (ii) the shaft basis system is used. The tolerances are disposed off unilaterally. [2015/10m/5e]
According to the ISO system, sketch the basic size, deviation, and tolerance on a shaft and hole assembly. Why uni-lateral tolerance is preferred over bi-lateral tolerance? [2014/10m/6a]
Bars of length 20.05/19.95 mm are in stock. From each, piece of 5.03/4.98 mm are cut. Determine the lengths of the remaining parts. [2013/10m/5c]
For a machined surface, show macro- and micro-irregularities. What are their causes? What are the various measures of surface finish? Explain any three of them. [2013/10m/5e]
The process capability of machines manufacturing holes and shafts is ±0.24 min. The assembly requirements for the hole/shaft, of nominal dimension 20.00 mm, are of clearance between 0.04 and 0.08 mm. Devise the complete scheme (state what it is?) so that satisfactory assemblies are made.
[Attached: Cumulative distribution function table for the standard normal distribution (SND), with a sketch of N(0, 1) and the note “For the SND, the table gives the cdf value at z, that is ” – not transcribed.] [2013/10m/6b]
Explain how flatness of a surface is measured with an optical flat. [2012/12m/5c]
Sketch the international prototype metre. Explain briefly, with reasons, its: (i) material (ii) cross section (iii) support points (iv) plane of marking (v) environment. [2011/10m/5b]
An interference assembly, of nominal diameter 20 mm, is of a unilateral holes and a shafts. The manufacturing tolerances for the holes are twice that for the shaft. Permitted interference values are 0.03 to 0.09 mm. Determine the sizes, with limits, for the two mating parts. [2011/10m/5d]
Draw a self explanatory sketch of Sigma mechanical comparator. Explain how (i) shock load is avoided, (ii) oscillations of the pointer are damped. [2011/10m/6a]
What is the difference between hole basis system and shaft basis system? Why is hole basis system the more extensive in use? What are the differences between interchangeability and selective assembly? [2010/12m/5d]
What do you mean by ‘interchangeable manufacture’ and ‘combination set’? [2009/8m/6a(i)]
What is the difference between a plug gauge and a ring gauge? [2009/4m/6a(ii)]
Discuss, with figure(s), pneumatic gauges and their applications. [2009/8m/6a(iii)]
Write six advantages of programmable machine tools. Define incremental and absolute system used in NC systems. Discuss the terms roughness, waviness, cutoff and flaws in surface texture measurement. What is the function of machine control unit in NC machines? [2008/20m/5b]
What is ‘Lay’? Describe with neat sketches and symbols the types of lay produced by different machining processes. [2005/20m/8a]
A hole and shaft have a basic size of 30 mm and are to have a clearance fit with maximum clearance of 0.04 mm and a minimum clearance of 0.02 mm. The hole tolerance is to be 1.5 times the shaft clearance. Determine limits for both hole and shaft using (i) a hole basis system (ii) a shaft basis system. [2003/30m/7a]
How will you measure taper on a machined component? Describe the procedure with the help of one example and neat sketches. [2002/30m/6b]
Distinguish between allowance and tolerance. What are unilateral and bilateral systems of specifying tolerances? What is the condition for a force fit or interference fit between mating parts? Why is hole basis system preferred over a shaft basis system? [2002/30m/7a]
With sketch, show basic surface characteristic of roughness and waviness. What do a, b, c, d, e and f shown in the typical specification illustration given below represent? Also indicate the values of surface roughness represented by the following triangles Δ, ΔΔ, ΔΔΔ, ΔΔΔΔ.
[Figure: Surface texture (machining) symbol standing on a hatched workpiece surface: a check-mark (V) symbol whose longer right arm extends upward and then horizontally to the right. Label “a ~ b” above the horizontal extension, “e” below the horizontal extension, “c” and “d” (c above d) to the left of the V near its short left arm, and “⊥ f” to the right of the V, just above the surface.] [2000/20m/5b]
Define tolerance, Limit and fit. If the fit for a shaft-bearing assembly is indicated by , what all informations you can infer from this? What types of gauges are needed to inspect these elements? [1999/20m/200w/5c]
(i) Distinguish between Waviness and Roughness of a machined surface. (ii) How do you define the surface finish under and systems [?]? (iii) In a turning operation following cutting conditions and tool geometry are used: Cutting speed = 20 meters/minute; Job dia = 50 mm; Feed = 0.3 mm/revolution; Depth of cut = 2 mm; Side cutting edge angle = 30°; (Approach angle = 60°); End cutting edge angle = 10°. Calculate the height of irregularities left by this operation. (iv) What do you suggest to improve the finish? (v) What is the R value in the above? [1999/30m/6b]
Describe the use of slip gauges for measuring lengths. Outline briefly the principles of working of a mechanical and an optical comparator for comparing lengths stating their relative merits. [1998/20m/200w/5a]
Differentiate between roughness and waviness. How do you measure the roughness of a ground surface using talysurf instrument? [1997/20m/7b]
Distinguish between form error and surface roughness for an engineering component. How are these caused? How is surface finish measured and explain any one of its measure and the units used. [1996/30m/6b]
4.7] Factory location and plant layout
22 questions
A manufacturing firm producing both standardized and customized products is planning a new facility. (i) Critically compare product layout and process layout in terms of material flow, flexibility, cost, demand variability and machine utilization. (ii) Explain the concept of cellular layout and analyze the challenges in its implementation along with its advantages. [2026/20m/8b]
With the help of a line diagram, explain the different types of flow patterns used in plant layouts. What are the conditions to be satisfied by an ideal flow pattern? [2025/10m/6c]
A company is interested in locating a new facility in a target market and would like to know the most appropriate place in the target market to locate the facility. There are four supply points , , and in the locality which will provide key inputs to the new facility. A two-dimensional grid map of the target market in which we would like to locate a new facility along with the distance coordinates of four supply points is shown in the figure below. The annual supply from these four points to the proposed facility is 200, 450, 175 and 350 tons, respectively:
[Figure: Two-dimensional grid map, X axis (Units) with grid lines at 100, 200, 300, 400, 500, 600, 700 and Y axis (Units) with grid lines at 100, 200, 300, 400, 500, 600; supply points plotted: (125, 550), (350, 400), (450, 125), (700, 300). Beside it the note “(Distance coordinates are in brackets)” and the table below]
| Supply Points | Coordinates (Units) | Annual Supply (tons) |
| (125, 550) | 200 | |
| (350, 400) | 450 | |
| (450, 125) | 175 | |
| (700, 300) | 350 |
Identify the most appropriate point in the grid map to locate the new facility using centre of gravity model. [2024/10m/8c]
A manufacturing company wants to arrange work-centres A, B, C and D, so as to minimize inter-departmental parts handling costs. The flow of parts and existing work-centres layout are shown below:
| A | B | C | D | |
| A | – | 400 | 500 | 50 |
| B | 300 | – | 200 | 0 |
| C | 0 | 0 | – | 700 |
| D | 0 | 0 | 0 | – |
Parts moved between work-centres
[Figure: Existing layout with distances – work-centres A, B, C and D arranged in a single row in that order, with 30 m between the centres of adjacent work-centres (A–B 30 m, B–C 30 m, C–D 30 m)]
Suggest a modified layout. [2023/10m/8c]
Discuss the factors influencing the facility location selection. [2022/10m/7b(i)]
For expansion of a car manufacturing plant, three new locations are to be considered based on three factors: Availability of labour, Proximity to the suppliers, and Proximity to the markets. The weightage of these factors are given as 40%, 35%, and 25% respectively. The rating (on 100-point scale) of the locations against these factors are given in the following table:
| Location | Availability of labour | Proximity to the suppliers | Proximity to the markets |
| X | 70 | 60 | 45 |
| Y | 60 | 45 | 90 |
| Z | 55 | 95 | 50 |
Find the best and worst location for the new plant. [2022/10m/7b(ii)]
Three cities namely Chennai, Delhi and Kolkata are being considered as potential locations for a new plant. Estimated data of annual fixed cost, variable cost and revenue per unit for each potential location are given below in the table. Determine the most attractive location for the plant if the estimated annual production volume desired is 40000 units. Also determine break-even production volume for each location.
| Head | City: Chennai | City: Delhi | City: Kolkata |
| Fixed cost (₹) | 800000 | 600000 | 500000 |
| Variable cost per unit (₹) | 30 | 40 | 50 |
| Revenue per unit (₹) | 60 | 60 | 60 |
[2021/15m/6b]
The layout of material storage section is given below. The material flow occurs between packing area (No. 6) and other 9 sections/areas. Loads are moved from packing area 6 to shipping/receiving area 1, while all other loads move from different sections/areas (2, 3, 4, 5, 7, 8, 9) to packing area No. 6. Average annual load movement/flow to/from sections is as under:
[Figure: Layout of the material storage section as a grid of blocks: top row ②, ③, ④; middle row ⑤, ‘Packing area ⑥’ (centre block), ⑦, with block ① attached to the left of ⑤; bottom row ⑧, ⑨, ⑩]
| Flow From – To | Average Annual Load (No.) | Distance Covered (m) |
| 2 to 6 | 200 | 50 |
| 3 to 6 | 300 | 50 |
| 4 to 6 | 400 | 50 |
| 5 to 6 | 500 | 50 |
| 7 to 6 | 600 | 50 |
| 8 to 6 | 700 | 50 |
| 9 to 6 | 800 | 50 |
| 10 to 6 | 900 | 50 |
| 6 to 1 | 4400 | 100 |
Assume cost of moving a load by unit distance (m) is ₹ 1/m. Determine the annual total cost of material handling. [2021/15m/8b]
Enlist various types of plant layouts. Compare product layout and process layout. [2020/10m/5d]
A company has narrowed the search for a new facility location to four places A, B, C and D. The estimated fixed costs/annum and variable cost/unit at the locations are given in the table below:
| Location | Fixed costs per annum (in ₹) | Variable costs per unit (in ₹) |
| A | 9,00,000 | 300 |
| B | 15,00,000 | 150 |
| C | 25,00,000 | 125 |
| D | 30,00,000 | 110 |
(i) Plot the total cost curves for all the four locations on single graph. Identify on the graph the approximate range over which each location provides the lowest cost. (ii) If the expected demand is 12,000 units per year, what is the best location? [2019/20m/6b]
(i) What is REL chart? Name closeness ratings. (ii) The layout of a plant consisting of six departments A, B, C, D, E and F is shown below. All departments are of the same size and configuration. The material handling cost per length travel between the departments is same. The handling frequencies between the departments are given in the table: Layout.
| A | C | E |
| B | D | F |
Handling Frequencies
| From \ To | A | B | C | D | E | F |
| A | – | 0 | 90 | 160 | 50 | 0 |
| B | – | – | 70 | 0 | 100 | 130 |
| C | – | – | – | 20 | 0 | 0 |
| D | – | – | – | – | 180 | 10 |
| E | – | – | – | – | – | 40 |
| F | – | – | – | – | – | – |
Taking the distance as a unit for the departments that share boundaries with the adjacent one, should the departments C and F be interchanged in location? Justify your answer. [2016/20m/6b]
A company is planning to manufacture medical testing equipment. Three locations A, B and C are under consideration. The estimated fixed costs/annum and variable cost/unit at the locations are given in the table below:
| Location | A | B | C |
| Fixed cost/Annum (in Lakh ₹) | 300 | 500 | 250 |
| Variable cost/unit (in ₹) | 3000 | 2000 | 3500 |
The average sale price of the equipment may be taken to be ₹ 7,000 per unit. (i) If the projected sales volume is 18000 units per year, which location should be chosen? (ii) How much will be the profit per year? [2016/10m/7b]
Discuss the advantages and limitations of ‘Process Layout’. [2015/10m/5d]
Fixed and variable costs for three potential manufacturing facilities for same product are shown below:
| Mfg. Facility | Fixed Cost/Yr. (Rs.) | Variable Cost/Unit (Rs.) |
| A | 1,25,000 | 50 |
| B | 2,00,000 | 40 |
| C | 2,50,000 | 20 |
(i) If the expected output is to be 8000 units per year, which facility should be selected? Explain with the help of a graph. (ii) When is option B economical? (iii) Comment on choice of the options. [2014/10m/5d]
State the basic principles of plant layout. Table below lists 12 work-elements along with their immediate predecessor elements and duration in minutes. Design suitable line consisting of appropriate work-stations assuming a cycle time of 20 minutes. Compute the line efficiency, balance delay and smoothness index:
| Work Element | Immediate Predecessor Element | Duration |
| A | – | 10 |
| B | A | 6 |
| C | B | 8 |
| D | A | 6 |
| E | B | 12 |
| F | E | 10 |
| G | F | 4 |
| H | G | 12 |
| I | F | 2 |
| J | F | 8 |
| K | G | 8 |
| L | H, I, K | 14 |
Use the least-number-of predecessors rule. [2014/20m/7b]
List the basic principles of plant layout. [2013/10m/5b]
What are the objectives of an efficient facility layout? What are the principles to be adopted to achieve these objectives? Compare product, process and cellular layout. [2012/10m/7c]
Briefly state the intermittent process layout problem. [2009/5m/6c(i)]
Five departments are currently arranged in the following manner:
[Figure: Layout of departments in two rows – top row: 1, 2, 3 (left to right); bottom row: 4 (below 1 and the left half of 2) and 5 (below the right half of 2 and 3).]
New products have been added and the movements between the departments have changed substantially since the existing arrangement was made. The movement between the departments is on rectangular path. The monthly number of trips, cost/trip and distance of each trip are given below:
| Item | 1–2 | 1–3 | 1–4 | 1–5 | 2–3 | 2–4 | 2–5 | 3–4 | 3–5 | 4–5 |
| Trips/month | 100 | 200 | 100 | 400 | 200 | 500 | 300 | 100 | 100 | 200 |
| Cost/trip | 12 | 34 | 56 | 34 | 57 | 25 | 17 | 43 | 63 | 52 |
| Distance units | 1 | 2 | 2 | 3 | 1 | 1 | 2 | 2 | 1 | 1 |
(1) Calculate the monthly cost of travel between the departments. (2) How much is the saving in monthly cost of travel between the departments, if departments 1 and 3 are interchanged? (3) A one-time cost of Rs 22,500 is associated with interchanging the positions of departments 1 and 3, and if this cost is to be recovered within two months, should the change be made? [2009/15m/6c(ii)]
National Bank is considering opening a teller window for customer service. Management estimates that customers will arrive for service at the rate of 15 per hour. The teller whom it is considering to staff the window can service customers at the rate of one every three minutes. Because of limited space availability and a desire to provide an acceptable level of service, the bank manager would like to assure, with 95 per cent confidence, that not more than three customers will be in the system at any one time. Assume Poisson arrivals and exponential service, compute (i) utilization of the teller, (ii) average number in the waiting line, (iii) average number in the system, (iv) average waiting time in line, (v) average waiting time in the system. What is the present level of service for the three-person limit? What level of utilization of the teller must be attained and what must be the service rate of the teller to assure the 95 per cent level of service? [2004/20m/5d]
A motor mechanic has a specialized garage for servicing of Maruti cars, The repair time is exponentially distributed with a mean of 30 minutes. Cars arrive for repair according to Poisson distribution with a mean time of 45 minutes between arrivals. The garage has a waiting space that can accommodate two cars, excluding the one being repaired. If the waiting area is full, they can wait outside on the road. What is the expected percentage of cars that have to wait outside because of inadequate waiting space? Instead of cars waiting outside for services, any car that comes for repair goes back not to return again if the waiting area in the garage is full. Find the expected percentage of customers lost due to inadequate waiting space. [1998/30m/7b]
A factory has a tool crib where mechanic come to check out special tools needed for the completion of a particular task assigned to them. A study is made of the time between arrivals and of the time required for service. Both distributions are found to be adequately described by the negative exponential. The average time between arrivals was found to be 50 seconds. Determine the waiting line length, waiting time and the percent of the idle time of the attendant. If the attendant is paid Rs. 2/- per hour and the mechanics are paid Rs. 4/- per hour, what policy or service should be established? What cost function should be minimized? When will a multi-channel single phase situation arise? [1995/60m/6]
4.8] Engineering economics and capacity planning
35 questions
A firm chooses between two processes (X and Y) to manufacture a component. Process X has a fixed cost of ₹ 9,60,000/year with a variable cost of ₹ 55/unit. Process Y has a fixed cost of ₹ 15,00,000/year with a variable cost of ₹ 38/unit. The selling price is ₹ 110/unit. (i) Calculate the break-even volume for each process independently. (ii) Determine the cross-over point between Process X and Process Y. (iii) If the firm forecasts demand of 35,000 units, compute the profit under each process and recommend a choice. What is the margin of safety (%) under the preferred process. [2026/10m/5b]
The following cost-related data has been collected from a company:
| Cost Element | Variable Cost | Fixed Cost |
| Direct material | 32.8 | – |
| Direct labour | 28.4 | – |
| Factory overheads | 12.6 | 1,89,900 |
| Distribution overheads | 4.1 | 58,400 |
| General administrative overheads | 1.1 | 66,700 |
| Budgeted sales | – | 18,50,000 |
Determine the following: (i) Break even sales volume (ii) Profit at the budgeted sales volume (iii) Profit if the actual sales I. Drop by 10%, and II. Increase by 5% from budgeted sales. [2025/10m/7c]
A certain component can be manufactured either by welding or by forging process. The factory has an order for 5,00,000 units. The costs involved for both methods of manufacturing are as follows:
| Cost | Welding | Forging |
| Fixed cost | ₹ 15,000 | ₹ 94,000 |
| Variable cost/unit | ₹ 5 | ₹ 4.25 |
(i) Which is the most economical method of manufacturing the component? Draw the indicative graph also for BEP. (ii) What will be the loss if a wrong choice is made? [2025/20m/8c]
A company produces both interior and exterior paints from raw materials and . The following table provides the basic data of the problem:
| Raw Material per ton of Paints (tons): Exterior Paint | Raw Material per ton of Paints (tons): Interior Paint | Maximum Daily Availability (tons) | |
| Raw Material | 6 | 4 | 24 |
| Raw Material | 1 | 2 | 6 |
| Profit per ton (₹) | 4,00,000 | 3,20,000 |
A market survey indicates that the daily demand for interior paint cannot exceed that for exterior paint by more than 1 ton. Also the maximum daily demand for interior paint is 2 tons. This company wants to determine the optimum product mix of interior and exterior paints that maximizes the total daily profit. Comment on the optimal solution if the objective function is maximization of . [2024/20m/7b]
corporation has given the following information on its capacity, sales and cost: (i) Current capacity = 100000 units (ii) At current level of operation, its margin of safety is 50% of its break-even point (iii) Contribution margin P/V ratio = 25% (iv) The unutilized capacity at present is 10000 units (v) Sales price is ₹ 40 per unit Based on the above information, determine the break-even point in sales volume, fixed costs, variable costs per unit and margin of safety in units. [2024/20m/8b]
A company is producing pumps. The cost of the structure of a pump is as under: Material cost: ₹ 1000/unit Labour cost: ₹ 500/unit Variable cost overheads: 50% of labour and material cost If the fixed cost for the production of pumps amounts to ₹ 10,00,000 and selling price (S) varies as , where D is demand in units, how many items will the company have to sell to reach break-even point? [2023/10m/6c]
Discuss the Expansionist strategy and Wait-and-See strategy for capacity timing and sizing concerning the capacity planning. [2022/10m/5c]
A company plans to sell an article at a local market. The articles are purchased at ₹ 5 on the condition that all unsold articles shall be returned. The rent of the space is ₹ 2,000. The articles will be sold at ₹ 9. Determine the number of articles which must be sold (i) To break-even. (ii) To earn ₹ 400 as profit. (iii) If the company sells 750 articles, calculate margin of safety and profit. [2020/10m/5e]
A component can be manufactured either on a centre lathe or on a turret lathe. The cost and time information to process a component is given below:
| Particulars | Centre lathe | Turret lathe |
| Set-up time | 30 minutes | 120 minutes |
| Processing time | 10 minutes | 5 minutes |
| Tooling-up cost (₹) | 200 | 500 |
| Labour cost/hr | ₹ 2 | ₹ 2 |
| Depreciation and other costs per hour | ₹ 10 | ₹ 20 |
The tooling-up cost is to be recovered within a year and there are no repeat orders. The requirements are to be met in two lots. (i) Calculate the quantity at which both alternatives result in equal cost. (BEP) (ii) Give the decision rule regarding the choice of lathes. (iii) If the quantity required is 800 nos/year, which of the machines do you propose? [2020/20m/6b]
A company manufactures a single product having a marginal cost of ₹ 1.50 per unit. Fixed cost is ₹ 30,000 per annum. The market is such that up to 40,000 units can be sold at a price of ₹ 3.00 per unit, but any additional sale must be made at ₹ 2.00 per unit. Company has a planned profit of ₹ 50,000. How many units must be made and sold? [2018/10m/5b]
The table below gives the standard time for the sawing off operation of different jobs being processed at a job order production unit. Table also gives average monthly requirement of each indicated item.
| Part Name | Standard time per piece (min) | Average quantity per month |
| Control shaft | 8.46 | 1,250 |
| Serration shaft | 8.46 | 1,250 |
| Oil pump gear | 5.40 | 4,000 |
| Helical oil pump gear | 4.80 | 2,000 |
| Brake shaft | 5.40 | 1,000 |
| Hub | 9.60 | 2,500 |
| Hex nut | 17.16 | 250 |
| Thread rolls | 96.0 | 30 |
Assume equipment is running at 75% efficiency with capacity hours at 80% utilisation. Consider 400 hours is available per month per machine. If presently the production unit has 4 power saw machines, determine additional requirement of machines. [2018/20m/6a]
Lathe machine operations take 40 min to produce a product. If the efficiency of the lathe machine is 80% and rejection is 20%, then determine the number of lathe machines required for producing 800 pieces per week. Assume 52 weeks per year and 48 hours per week as working hours available. [2017/20m/7b]
A manufacturing company is producing an item for which the following information is given: Selling price per unit = ₹ 20 Variable cost per unit = ₹ 10 Fixed cost = ₹ 2,00,000 However due to changing market condition, variable cost increased by 20% and fixed cost increased by 10%. If the breakeven quantity is maintained, then what will be the revised selling price? [2017/15m/7c]
Use the dual simplex method to solve the following problem: with and non-negative. [2015/20m/8a]
A manufacturing organisation is considering investment in two alternative equipments A and B. Equipment A costs Rs. 30,000 while the equipment B costs Rs. 50,000. The expected yearly net income for the first five years from these equipments are Rs. 10,000 and Rs. 15,000 for equipments A and B respectively. Assuming the cost of capital as 12% per annum, determine which equipment should be selected. Use net present value approach. [2014/10m/8c]
(i) A firm manufactures a product whose selling price is ₹ 10. It has a capacity of 10,000 units. The variable costs are ₹ 2.50 per unit. The fixed costs are estimated at ₹ 30,000 up to 50% capacity utilization, ₹ 36,000 above 50% level, and ₹ 42,000 if the utilization is 80% or above. a. What will be the operating profit of the firm at 70%, 80% and 90% utilization? b. What is the lowest level of activity at which the firm can make a profit of ₹ 18,000? (ii) What is detailed work factor system of PMT? List the common areas of its application. [2012/20m/8b]
Three processes viz. automatic, semi-automatic and manual can be used to produce an item. The initial annual fixed cost and variable cost/unit for each of them is given below:
| Process | Annual fixed cost ₹ | Variable cost/unit ₹ |
| Automatic A | 2,50,000 | 10 |
| Semi-automatic S | 1,50,000 | 20 |
| Manual M | 50,000 | 60 |
(i) Draw the total annual cost curves for the processes. (ii) Find the range of production volume for each process when it is most economical. (iii) Which process will you recommend if the forecasted production is 8000 units/annum? (iv) What is the most economic unit cost if the production is 8000 units/annum? [2011/20m/6e]
Six operators are to be assigned to six machines. Their efficiency on the machines is given in the matrix below:
| Operator \ Machine | 1 | 2 | 3 | 4 | 5 | 6 |
| A | 0.92 | 0.95 | 0.90 | 0.85 | 0.75 | 0.91 |
| B | 0.94 | 0.90 | 0.88 | 0.85 | 0.95 | 0.93 |
| C | 0.75 | 0.00 | 0.77 | 0.70 | 0.00 | 0.76 |
| D | 0.88 | 0.85 | 0.90 | 0.80 | 0.85 | 0.90 |
| E | 0.55 | 0.95 | 0.90 | 0.94 | 0.95 | 0.90 |
| F | 0.50 | 0.75 | 0.74 | 0.80 | 0.80 | 0.00 |
(i) Assign the operators to the machines to maximize overall efficiency. (ii) State the steps clearly. (iii) Is there any alternative optimal solution? Justify your answer. [2011/30m/8a]
XYZ Corporation has a production (and sales) capacity of ₹ 10,00,000 per month. Its fixed costs are ₹ 3,50,000 per month and the variable costs over a considerable range of volume are ₹ 0.50 per Rupee of sales. (i) Determine annual break-even point and develop break-even graph. (ii) Determine the effect on break-even point if fixed costs were decreased by 10% and the variable costs per unit are increased by the same percentage. [2010/12m/5b]
A company manufactures two products A and B. The manufacturing and marketing data for the two products is given below:
| Department | Product A | Product B | Capacity |
| Welding | 2.0 man-hr | 2.5 man-hr | 1000 man-hr |
| Machines | 3.0 man-hr | 1.5 man-hr | 1200 man-hr |
| Assembly | 1.5 man-hr | 4.0 man-hr | 1200 man-hr |
| Profit | Rs 120 | Rs 100 |
(1) Formulate the problem. (2) Find the product mix that will maximize the profit. [2009/10m/7c(ii)]
ABC Ltd. has an order for 500000 parts. These parts can be manufactured either by machining process or by forging process. The costs involved in two methods of manufacturing are as follows:
| Costs ↓ / Process → | Machining | Forging |
| Fixed costs (Rs) | 15,000 | 95,000 |
| Variable costs per part (Rs) | 6 | 5 |
(i) Which of the two methods will be more profit-making for ABC Ltd.? (ii) Find the minimum order quantity for the forging process to be economical. [2008/20m/5c]
Four different castings are to be machined on four machines, one casting on each machine, because set-up cost and time are too high to permit a casting being worked on more than one machine. Table below shows time of machining each casting on each machine. Assign the jobs on machines and show that the problem is multi-optimal solutions. Obtain sequential solution.
| Casting | ||||
| 10 | 14 | 22 | 12 | |
| 16 | 10 | 18 | 12 | |
| 8 | 14 | 20 | 14 | |
| 20 | 8 | 16 | 6 |
[2007/30m/7a]
Following is information regarding a manufacturing enterprise: Total fixed costs = Rs. 4,500; Total variable costs = Rs. 7,500; Total sales = Rs. 15,000; Units sold = 5,000. Find out: (i) Break-even point in units (ii) Margin of safety (iii) Profit (iv) Volume of sales to earn a profit of Rs 6,000. [2006/20m/5c]
Five different machines can do any of the five required jobs, with different profits resulting from each assignment as shown in the table. Find out maximum profit possible through optimal assignments.
| Job \ Machine | M1 | M2 | M3 | M4 | M5 |
| J1 | 30 | 37 | 40 | 28 | 40 |
| J2 | 40 | 24 | 27 | 21 | 36 |
| J3 | 40 | 32 | 33 | 30 | 35 |
| J4 | 25 | 38 | 40 | 36 | 36 |
| J5 | 29 | 62 | 41 | 34 | 39 |
[2006/30m/7a]
A cottage industry produces two types of toys which are sold with a profit margin of Rs. 10 for toy 1 and toy 2 respectively. The assembly cost and packing cost for one unit of type 1 are Rs. 4 and Rs. 5 respectively, and corresponding figures for type 2 are Rs. 5 and Rs. 2. The expenditure on assembly and packing is to be kept strictly within and up to Rs. 100 and Rs. 80 respectively. Using Simplex Method, calculate the number of toys of each type to be manufactured to get maximum profit. [2005/20m/7c]
(i) What is the objectives of break-even analysis? The cost of producing between 1500 units and 2500 units of a product consists of Rs. 25,000 fixed cost and Rs. 10 per unit variable cost. With the selling price at Rs. 20 per unit, what is the break-even point? Suppose the price per unit was increased to Rs. 25. Illustrate with a neat sketch how does this affect the break-even point. (ii) What are the various purposes of inventory control? According to the economic lot size formula, if the annual requirement for an item is 8,000 units, set up cost are Rs. 20, and the cost of holding the item in inventory is Re. 0.20 per year, what is the economic lot size to order? Supposing the holding cost doubled to Re. 0.40 per year, what is the percentage effect on the order size? [2004/20m/5c]
Solve the following linear programming problem graphically: [2004/30m/8a]
A plant manufactures two products A and B, using three inputs, labour, material R and material S. To make one unit of product A, it requires 6 kg of R and 7.5 kg of S, and 9 person-hours of labour. To make one unit of B it requires 12 kg of R and 4.5 kg of S and 6 person-hours of labour. The demands for the products are such that the plant can sell as much of each of the product as it can produce. It earns a profit of Rs. 30 per unit of A and Rs. 40 per unit of B. However only 900 kg of R and 675 kg of S and 1200 person-hours of labour are available each day. (i) Formulate the plant’s strategy as a linear program to maximize the profit. (ii) Indicate the feasible region in a graphical representation of the problem. (iii) Solve the problem graphically by finding the optimum operating point. What is the maximum profit? [2003/30m/8b]
A company produces two principal product lines – a powerful portable circular saw and precision table saws. Both product lines share the same production capacity and are sold through the same sales channels. The average profit is Rs. 900 for each circular saw and Rs. 600 for each table saw. The production capacity is constrained in fabrication and assembly capacity. A maximum of 4000 hours of fabrication capacity is available per month, and each circular saw requires two hours and each table saw requires one hour. A maximum of 5000 hours of assembly capacity is available per month, and each circular saw requires one hour and each table saw requires two hours. The marketing department estimates that there is a maximum market demand next year of 3500 saws per month for both product lines combined. (i) Is there a single managerial objective? What is it? (ii) What are the alternative feasible product mix possibilities? (iii) What is the optimal product mix? [You can use either graphical or simplex method] (iv) How much could the company product optimally if it was seen that the estimates of the next years market demand have been raised to 4000? What would be the maximum total profit? [2002/30m/8b]
Solve the following linear programming problem graphically or otherwise [2001/20m/7b]
Distinguish between the situations where transportation models and assignment models may be used. A job shope type machine tool company employs a team of 4 assemblers with varying capabilities. It has received an urgent order to supply 4 assemblies as soon as possible and decides to assign one assembly to each assembler. Assign the assemblies to assemblers so that the total cost is minimized. The following matrix shows the cost of assembly by each assembler in hundreds of rupees. Also calculate the total cost of the 4 assemblies.
Cost matrix (columns: Assembler; rows: Assembly):
| 5 | 7 | 6 | 8 |
| 7 | 4 | 4 | 9 |
| 3 | 6 | 9 | 6 [?] |
| 8 | 2 | 6 | 1 |
[2000/30m/8a]
A company has 4 salespersons and 4 clients to be visited. Each salesperson can visit only one client because of time constraint. The profit records from previous visits are shown in the table and it is required to maximize the profit by the best assignment:
| Clients | Salespersons, Profit (in Rs.): A | Salespersons, Profit (in Rs.): B | Salespersons, Profit (in Rs.): C | Salespersons, Profit (in Rs.): D |
| 1 | 60 | 120 | 200 | 120 |
| 2 | 220 | 180 | 150 | 200 |
| 3 | 120 | 160 | 180 | 150 |
| 4 | 160 | 80 | 120 | 200 |
(i) Assign the salespersons to appropriate clients to maximise (ii) What are the maximum profits? (iii) Instead of profits, if the matrix indicates the distances to be traveled by each salesperson to the respective client and if the distance traveled by each salesperson is to be minimized, what will be the change in your solution procedure? [1999/30m/8b]
A machine shop manager has two machines that can do the same operations. The set up costs and the variable costs are given below.
| Machine | Set-up cost (Rs.) | Variable cost/unit (Rs.) |
| A | 80 | 2.40 |
| B | 800 | 0.90 |
A decision has to be taken to select the machine A or B to minimize the total cost of production when an order comes. (i) Determine the total cost equation for the two machines. (ii) At what volume of production do machines A or B breakeven? (iii) What is the decision rule? [1997/20m/200w/5d]
Two products or are to be produced which require machining on machines and and as per the following table:
| Machine | Machine hours required for | Machine hours required for | Total machine hours available |
| 1 | 2 | 40 | |
| 3 | 2 | 60 |
Profit contribution rates for and are Rs. 60 and Rs. 50 respectively. Obtain a solution for the manufacture of products and so as to maximize the profit. [1997/30m/6a]
The final product of firm has a requirement that it must weigh exactly 150kg. The two raw materials used in the manufacture of this product are A, costing Rs. 2 per unit, and B costing Rs 8 per unit. Each unit of A and B weighs 5kg and 10kg respectively. At least 14 units of B and no more than 20 units of A must be used. How much of each type of raw material should be used for each unit of the final product if cost is to be minimised? [1996/20m/8a]

Preparing for Prelims too?
Our UPSC Prelims Topic-wise PYQ eBook covers every Prelims question with detailed explanations, so you can see exactly where UPSC asks from.
View the BookDownload Free Sample4.9] Predetermined time standards
12 questions
A manufacturing firm is redesigning its assembly line and is debating whether to use traditional time study (stopwatch) or predetermined time standards (PTS). Answer the following: (i) Explain the conceptual basis of PTS. What fundamental assumption makes it possible to preassign time values to basic motions independently of the task context? (ii) Describe two specific situations in which PTS would be preferred over time study for capacity planning purposes, and two situations where it would be inappropriate. [2026/15m/7c]
(i) Define ‘Standard time’. (ii) How is the observed time converted to standard time? List the admissible allowances. [2016/10m/5c]
What are the principles of motion economy related to work place? If these principles are adopted in design of work place, what will be the advantages? [2012/12m/5e]
(i) A firm manufactures a product whose selling price is ₹ 10. It has a capacity of 10,000 units. The variable costs are ₹ 2.50 per unit. The fixed costs are estimated at ₹ 30,000 up to 50% capacity utilization, ₹ 36,000 above 50% level, and ₹ 42,000 if the utilization is 80% or above. a. What will be the operating profit of the firm at 70%, 80% and 90% utilization? b. What is the lowest level of activity at which the firm can make a profit of ₹ 18,000? (ii) What is detailed work factor system of PMT? List the common areas of its application. [2012/20m/8b]
An activity has four elements. The activity is work-measured and the times (r) are recorded on continuous basis over five cycles. The observations are given in table:
| Work Element | Observations: Cycle→1 | 2 | 3 | 4 | 5 | Rating Factor |
| 1 | 0.50 | 3.30 | 5.70 | 8.20 | 10.85 | 1.1 |
| 2 | 0.70 | 3.45 | 5.95 | 8.55 | 11.10 | 1.2 |
| 3 | 1.45 | 4.05 | 6.50 | 9.25 | 11.75 | 1.2 |
| 4 | 2.75 | 5.25 | 7.60 | 10.35 | 13.05 | 0.9 |
The time r is recorded at the end of work-element. (i) Calculate: (a) Normal time of the activity (b) Standard time for the activity, if the allowance is 20%. (ii) What is the appropriate sample size for estimating the time for element 2 within ±10% of the true mean with 95% confidence; the standard deviation for the time for element 2 is 0.0742. [2011/30m/7a]
Compare ‘Work Sampling’ with ‘Time Study’. When are they used for calculating standard time of performing short cycle jobs? Give respective areas of application. [2010/12m/5a]
Explain briefly the MTM. Which basic motions does it recognize? Suggest its applications and also describe the sequence of steps of procedure to implement the same. [2009/12m/5d(i)]
(i) Describe steps to be followed during “Time Study”. (ii) In a turning shop, a direct time study was on a step turning. The study was conducted by an experienced industrial engineer and one inexperienced engineer. They agreed precisely on cycle, time shown in Table below, but their opinion on rating of workers was differed. The experienced engineer rated the worker 100% and the other engineer rated the worker 120%. They used 0.10 allowance fraction.
| Cycle Time (minutes) | Number of Times observed |
| 21 | 2 |
| 25 | 1 |
| 30 | 1 |
| 33 | 1 |
Determine the standard time using rating of each engineer.
[Attached: Cumulative distribution function for the standard normal distribution (SND) table, two pages, printed after Paper I] [2007/30m/8b]
A work measurement study was conducted in a manufacturing company for 8 hours and following observations were made: Idle time: 15%; Performance rating: 120%; Allowance time: 12% of standard time; Number of units produced: 320. Calculate the standard time for the task. [2006/20m/5d]
Explain the difference between operation chart, activity chart, and flow process chart. What are their respective areas of application? [2005/20m/5c]
Differentiate between method study and motion analysis. How are they used in job design? The elemental times (in minutes) for 4 cycles of an operation using a time measuring device are presented below.
| ELEMENTS | C1 | C2 | C3 | C4 |
| 1 | 3.0 | 3.0 | 2.6 | 2.8 |
| 2 | 5.2 | 5.4 | 4.8 | 5.2 |
| 3 | 6.6 | 6.4 | 6.8 | 6.8 |
| 4 | 2.4 | 2.4 | 2.2 | 2.4 |
| 5 | 1.02 | 1.02 | 1.04 | 0.96 |
Calculate standard time for the operation, if (i) Elements 2 and 4 are machine dependent. (ii) For other elements, the operator is rated at 110%. (iii) Total allowances are 15% of the normal time. [2003/20m/5d]
In a stop watch time study, the actual readings in minutes recorded for an element are 0.05, 0.06, 0.05, 0.05, 0.05, 0.06, 0.06, 0.05, 0.06, 0.06, 0.06, 0.06, 0.05, 0.05, 0.06 and 0.05. (i) Have sufficient number of readings been taken for 95% confidence level and ± 5% accuracy? (ii) If the rating is 120%, what would be the normal time for the element? (iii) What would be the standard time for the element if the personal needs allowance; fatigue allowance and contingency allowance are 5%. 6% and 5% respectively? (iv) What is the purpose of providing contingency allowance? Give two examples. [2000/30m/7a]
4.10] Forecasting
17 questions
In an automobile manufacturing industry the demand for a specific part was 250 in April, 100 in May and 200 in June. The forecast for April was 150. Calculate the forecast for the month of July with a smoothing constant of 0.25 and using first order exponential smoothing. [2025/10m/5c]
A manufacturer of toys for children in the age group of 2 to 4 years commissioned a market research firm to understand the factors that influenced the demand for the product. After some detailed studies, the research firm concluded that the demand was a simple linear function of number of newlywed couples in the city. Based on this assumption, build a model for forecasting the demand for the product using the data in the table given below, which is collected from a residential area in a city:
| New Marriages () | Demand for Toys () |
| 200 | 165 |
| 235 | 184 |
| 210 | 180 |
| 195 | 145 |
| 225 | 190 |
| 240 | 169 |
| 217 | 180 |
| 225 | 170 |
[2024/10m/5e]
On the given data, perform regression analysis to forecast the demand for the year, considering that the demand is increasing approximately exponentially. (; where a and b are constants, x is the number of the year and y is forecasted demand)
| No. of the year | 1 | 2 | 3 | 4 | 5 |
| Demand (units) | 40 | 60 | 200 | 700 | 1000 |
[2023/10m/5e]
An XYZ company launched a new product which had sales of 5, 17, 29, 41 and 39 units respectively in its first five months of launch. The Sales Manager now wants a forecast of sales in the next month. (i) Find out sales forecast by the last value method, the averaging method and the moving average method with the 3 most recent months. (ii) Given the sales pattern so far, do any of the above methods seem inappropriate for obtaining the forecast? Why? [2021/10m/5d]
The sales for a critical component manufactured by a company are given below. Forecast the demand for the components for the next three years using regression method:
| Years | Sales (’000) |
| 1986 | 30 |
| 1987 | 33 |
| 1988 | 37 |
| 1989 | 39 |
| 1990 | 42 |
| 1991 | 46 |
| 1992 | 48 |
| 1993 | 50 |
| 1994 | 55 |
| 1995 | 58 |
[2020/20m/7a]
(i) Write the major components of TQM philosophy. (ii) How do you incorporate the seasonal variations in demand forecasting? [2019/10m/5e]
The demand for a product during the last 10 years is given below. Estimate the demand for the 11th and 12th year by method of regression.
| Year | 1 | 2 | 3 | 4 | 5 | 6 | 7 | 8 | 9 | 10 |
| Unit | 124 | 135 | 145 | 150 | 167 | 157 | 161 | 170 | 187 | 168 |
[2018/10m/5d]
The demand for an item is 500 units and 600 units for July and August respectively. Considering forecast for July as 300 units, determine the forecast for September using exponential smoothing method. Assume value of as 0.3. [2017/10m/5e]
A company manufacturing washing machines establishes a relationship between the sale of washing machines and the population of the city. The market research carried out reveals the following information:
| Population of the city (in lakhs) | 5 | 7 | 15 | 22 | 27 | 36 |
| No. of washing machines demanded (unit in hundreds) | 28 | 40 | 65 | 80 | 96 | 130 |
Fit a linear regression equation and estimate the demand of washing machines for a city of population of 45 lakhs. [2016/20m/8b]
A transport company assumes that the requirement of tyres used in vehicles are closely related to number of kilometres driven. Accordingly, the following data covering the last six months have been collected as follows:
| Months | Tyres Used | Thousands of km driven |
| 1 | 100 | 1500 |
| 2 | 150 | 2000 |
| 3 | 120 | 1700 |
| 4 | 80 | 1100 |
| 5 | 90 | 1200 |
| 6 | 180 | 2700 |
(i) Establish the relationship (linear) between the required tyres and kms driven based on data. How good is the co-relation? (ii) If expected kms drive in a month is 32,00,000, forecast the demand for tyres. [2014/10m/7c]
The following table gives the monthwise actual demand of units of some product:
| Month | March | April | May | June | July | August |
| Demand (units) | 350 | 440 | 450 | 460 | 495 | 510 |
The forecasted demand for the month of March was 400 units. The firm uses exponential smoothing method with smoothing factor 0.2 to forecast demand. (i) Calculate the tracking signal for the model. (ii) Comment on the smoothing factor. [2013/20m/6d]
Name the factors to be considered while choosing a good forecasting system. [2009/5m/5c(i)]
The quarterly demand of a company product for past six years is given in the table below. The four-quarter moving average is also given. Find the seasonality index for 3rd quarter.
| Year | Quarter | Demand units | Four Quarter Moving Average |
| 1 | 0.5 | ||
| 1 | 0.8 | 0.875 | |
| 1 | 2.1 | 0.925 | |
| 1 | 0.1 | 1.025 | |
| 2 | 0.8 | 1.1 | |
| 2 | 1.1 | 1.1 | |
| 2 | 2.4 | 1.125 | |
| 2 | 0.1 | 1.15 | |
| 3 | 0.9 | 1.25 | |
| 3 | 1.2 | 1.25 | |
| 3 | 2.8 | 1.20 | |
| 3 | 0.1 | 1.15 | |
| 4 | 0.7 | 1.10 | |
| 4 | 1.0 | 1.10 | |
| 4 | 2.6 | 1.125 | |
| 4 | 0.1 | 1.125 | |
| 5 | 0.8 | 1.10 | |
| 5 | 1.0 | 1.10 | |
| 5 | 2.5 | 1.15 | |
| 5 | 0.1 | 1.20 | |
| 6 | 1.0 | 1.25 | |
| 6 | 1.2 | 1.275 | |
| 6 | 2.7 | ||
| 6 | 0.2 |
[Table layout: in the printed table each four-quarter moving average is printed on the dividing line between the quarter in whose row it is placed here and the next quarter (e.g. 0.875 between and of Year 1).] [2009/15m/5c(ii)]
(i) What are the sources of error in forecasting? (ii) With the help of regression analysis, compute the demand for computers when the populations are 36, 45, 50 and 55 millions from the collected data as give below:
| Population (in millions) | Number of computers demanded (in thousand) |
| 5 | 28 |
| 7 | 40 |
| 15 | 65 |
| 22 | 80 |
| 27 | 96 |
Draw the demand curve using computed value. [2008/30m/7a]
A small electronics company produces pocket calculators and records the demand monthly. The following demand data are for a representative calculator: November 45; December 57; January 60. Using 50 as the first-order exponential smoothing forecast for November, forecast February sales with a smoothing constant of 0.2. Is 0.2 a good choice as a smoothing constant? Comment. [2005/10m/7b]
Consider the following time series data: (i) Using a 3-week moving average, what is the forecast for week 7? (ii) Using for exponential smoothening, what is the forecast for week 7? (iii) Using the mean squared forecast error as a basis, which forecast for week 7 would you recommend?
| Week | 1 | 2 | 3 | 4 | 5 | 6 |
| Value | 8 | 13 | 15 | 17 | 16 | 9 |
[2002/20m/5a]
The demand for a newly introduced luxury car has been shown below. The experts forecasted a sale of 100 cars for the month of March. With a smoothing constant of 0.15 and using first order exponential smoothing what is the forecast for the month of August? Also calculate MAD and Bias and give your comments on the same:
| Month | Actual Demand |
| March | 150 |
| April | 200 |
| May | 100 |
| June | 50 |
| July | 150 |
[2000/30m/7b]
4.11] Assembly line design and balancing
8 questions
Five different products are manufactured in a mixed model production line. The time required for each task is given below:
| Task | Product 1 (Seconds) | Product 2 (Seconds) | Product 3 (Seconds) | Product 4 (Seconds) | Product 5 (Seconds) |
| A | 5 | 5 | – | 5 | 5 |
| B | 6 | 6 | 6 | – | 6 |
| C | 6 | – | 6 | 6 | – |
| D | 7 | 7 | – | – | 7 |
| E | – | 4 | 4 | 4 | – |
Each product requires a set of tasks. Calculate the total number of work stations for this mixed-model assembly line, if the cycle time is 15 seconds. [2025/10m/5d]
A factory working in two shifts, each of 8 hours, produces 28000 tube lights using a set of workstations. Using this information, compute the actual cycle time of the plant operation. There are 6 tasks required to manufacture the tube light. The sum of all task times is equal to 10 seconds. How many workstations are required to maintain this level of production assuming that combining of tasks into those workstations is a feasible alternative? [2024/10m/5c]
The corporation ‘X’ is designing its new assembly line. The line will produce 50 units per hour. The tasks, their times, and their predecessors are shown in the following table:
| Task | Immediate Predecessor | Task Time (sec.) |
| A | – | 55 |
| B | A | 30 |
| C | A | 22 |
| D | B | 35 |
| E | B, C | 50 |
| F | C | 15 |
| G | F | 5 |
| H | G | 10 |
(i) Draw the network diagram. (ii) Compute the cycle time with a desired output of 50 units/hour. (iii) Compute the theoretical number of work-stations and assign the task on the work-stations. Did you end up using more work-stations than the theoretical minimum? (iv) Compute the efficiency and balance delay of the line. (Use longest time method) [2023/10m/5d]
An assembly line is to produce 180 units per 8-hour shift. The following table identifies the work elements, times, immediate predecessors:
| Work Element | Time (Seconds) | Immediate Predecessor(s) |
| A | 45 | None |
| B | 70 | A |
| C | 35 | D, E, F |
| D | 30 | B |
| E | 25 | B |
| F | 20 | B |
| G | 110 | A |
| H | 140 | G |
| I | 130 | H |
| J | 120 | C, I |
(i) Find the desired cycle time. (ii) Find the theoretical minimum number of workstations required. (iii) Draw the precedence diagram. (iv) What are the efficiency and balance delays of the solution found? [2019/20m/6a]
State the basic principles of plant layout. Table below lists 12 work-elements along with their immediate predecessor elements and duration in minutes. Design suitable line consisting of appropriate work-stations assuming a cycle time of 20 minutes. Compute the line efficiency, balance delay and smoothness index:
| Work Element | Immediate Predecessor Element | Duration |
| A | – | 10 |
| B | A | 6 |
| C | B | 8 |
| D | A | 6 |
| E | B | 12 |
| F | E | 10 |
| G | F | 4 |
| H | G | 12 |
| I | F | 2 |
| J | F | 8 |
| K | G | 8 |
| L | H, I, K | 14 |
Use the least-number-of predecessors rule. [2014/20m/7b]
An assembly line is to produce 40 microwave ovens an hour. The relevant data for the work elements involved in assembly are given below:
| Work element | Time (sec) | Immediate Predecessor(s) |
| A | 20 | None |
| B | 55 | A |
| C | 25 | B |
| D | 40 | B |
| E | 05 | B |
| F | 35 | A |
| G | 14 | D, E |
| H | 40 | C, F, G |
(i) Draw the precedence diagram. (ii) Design a balanced assembly line. (iii) Calculate (a) idle time, (b) efficiency, and (c) balance delay. (iv) What can be the maximum output from this assembly line? [2013/25m/7a]
Following table shows the predecessor relationship of the activities in an assembly line. The output is 200 units per day and operating time is 450 minutes per day. Using the most successors rule to assign tasks to work centre and longest work time rule as a tie breaker, (a) group the tasks into work centres and (b) compute balance efficiency, idle time and balance delay.
| Task | Predecessor | Time (sec) |
| A | None | 40 |
| B | A | 20 |
| C | None | 60 |
| D | C | 40 |
| E | D | 30 |
| F | None | 35 |
| G | None | 45 |
| H | G | 60 |
| I | H | 40 |
[2012/12m/5d]
The assembly line for small tricycles has the following work elements identified and the sequence indicated.
| Work element | Immediate Predecessor of the work element | Work element time (in minutes) |
| A | Nil | 5 |
| B | Nil | 3 |
| C | B | 3 |
| D | A, C | 2 |
| E | D | 2 |
| F | D | 3 |
| G | E, F | 5 |
| H | E, F | 8 |
| I | G, H | 1 |
| J | I | 1 |
For the above (i) prepare the precedence diagram. (ii) using Helgeson and Bimic or any other heuristic method, show a feasible grouping of the work elements and number of workstations, assuming that the cycle time of one assembly is 8 minutes. (iii) calculate the balance-delay for your arrangement. [2000/20m/5a]
4.12] Inventory management and JIT
37 questions
A spare parts store faces stochastic demand. Annual demand is normally distributed with mean () = 2400 units and standard deviation = 300 units. Lead time is fixed at 2 weeks. Assume 50 working weeks/year. Ordering cost = ₹ 800/order, Holding cost = ₹ 18/unit/year, Unit cost = ₹ 240, and Stockout cost = ₹ 90/unit short. The store operates with a continuous review policy. (i) Compute the Economic Order Quantity. (ii) Determine the demand during lead time (mean and standard deviation). (iii) If the desired service level is 95% (), calculate the safety stock and reorder point. (iv) Compute the total annual inventory cost (ordering + holding + safety stock holding). By how much does safety stock inflate total holding cost compared to the zero safety stock scenario? [2026/20m/8c]
The annual requirement of an item is 2400 units. Each item costs the company ₹ 6. The manufacturer offers a discount of 5% if 500 or more quantities are purchased. If the ordering cost is ₹ 32 per order and inventory cost is 16%, determine whether it is advisable to accept the discount. [2025/20m/7b]
A car manufacturing unit uses large quantities of a component made of steel. The demand is continuous and inventory planning could be done independent of the production plan. The annual demand for the component is 2500 boxes. The company procures the item from a supplier at the rate of ₹ 1,250 per box. The company estimates the cost of carrying inventory to be 20 percent/unit/annum and the cost of ordering as ₹ 1,200 per order. The company works for 250 days in a year. How should the company design an inventory control system for this item? What is the total cost of the plan? [2024/10m/5d]
List down different types of wastes indicated in JIT system. How are they connected with flow layout? [2024/10m/6c]
The following information is given for the items procured and sold by a shopkeeper: Annual Demand: 8000 units Ordering Cost: ₹ 180/order Holding Cost: 10% of the item cost Following offers are given to the shopkeeper for different lot sizes:
| Lot Size | Unit Price (₹) |
| 1 – 999 | 22.00 |
| 1000 – 1499 | 20.00 |
| 1500 – 1999 | 19.00 |
| 2000 and above | 18.50 |
Check the feasibility of different offers using Economic Order Quantity and compare the total annual costs of the feasible offers. [2023/20m/7b]
A product is to be processed from its raw form to finished form through a number of workstations. The production lead time is given as 3 days. The daily demand requirement is 500 units. Safety stock is required for one day. Container’s capacity is 400 units. Determine the number of Kanbans (containers) required. [2022/10m/5d]
Derive the expression for Reorder point when demand is variable and lead time is constant. Suppose the average demand is 18 units per week with a standard deviation of 5 units. The lead time is constant at 2 weeks. Determine the safety stock and reorder point if management wants a 95% customer service level. (Refer Standard Normal Distribution table given on the last page) [2022/10m/5e]
Discuss the ABC, VED and SDE classification of inventory items. [2022/10m/8b(i)]
A plastic moulding company provides the following details of various products in terms of annual demand and unit cost. Classify the products in A, B and C categories.
| Item Code # | Annual Demand | Cost/Unit (₹) |
| XA-101 | 400 | 4.00 |
| XA-102 | 300 | 5.00 |
| XA-103 | 120 | 3.00 |
| XA-104 | 80 | 2.00 |
| XA-105 | 50 | 2.50 |
| XA-106 | 40 | 1.50 |
| XA-107 | 20 | 2.20 |
| XA-108 | 15 | 32.00 |
| XA-109 | 8 | 51.80 |
| XA-110 | 6 | 42.00 |
| XA-111 | 5 | 3.00 |
[2022/10m/8b(ii)]
What are the reasons for carrying inventories in production industries? [2021/10m/5c]
Enlist the basic elements of JIT and explain Kanban card in brief. [2020/10m/7c]
The annual demand for a component is 2500 boxes. The company procures the item from a supplier at the rate of ₹ 750 per box. The company estimates the cost of carrying inventory to be 18% per unit per annum and the cost of ordering as ₹ 1,080 per order. The company works for 250 days in a year. How should the company design an inventory control system for this component? What will be the overall cost of the plan? [2020/20m/8a]
A cloth merchant has an average demand of 50 jeans per day with a standard deviation of 4 jeans per day. The average lead time of supply of jeans is 7 days and standard deviation of lead time is 2 days. Calculate the ROL (Reorder Level) with 95% service level. (Given Z at 95% = 1.65) [2019/10m/5b]
What do you understand by Just-In-Time (JIT)? What benefits can occur to the company from the application of JIT technique? [2018/15m/6b]
A company has got a demand for a particular part at 10,000 units per year. The cost per unit is ₹ 2.00. It costs ₹ 36.00 to place an order and to process the delivery. The inventory carrying cost is estimated at 9% of average inventory investment. Determine: (i) Economic order quantity (ii) Optimum number of orders to be placed per annum (iii) Minimum total cost of inventory per annum. [2018/15m/7c]
Monthly consumption of an item is 350 units and price per unit is ₹ 15. Inventory carrying cost is 20 percent and ordering cost is ₹ 40 per order; lead time of 1 month’s stock. Assuming ROL system, calculate the following: (i) Reorder quantity (ii) Reordering level (iii) Minimum level (iv) Maximum level (v) Average inventory. [2017/15m/8a]
A contractor has a requirement of cement that amounts to 1500 bags per day. No shortages are allowed. Cement costs ₹ 400 per bag. Holding costs are ₹ 0.2 per bag per day and the ordering process cost per order is ₹ 150. (i) Find the optimal lot size and the system cost per day. (ii) If, however, the price per bag is quoted in accordance with the following schedule:
| Purchase Quantity (Bags) | Price/Bag (₹) |
| 0 – 1999 | 400 |
| 2000 and above | 395 |
Should the contractor take advantage of the quantity discount? [2016/20m/8c]
Derive an expression for Economic Order Quantity (EOQ) when stock replenishment is non-instantaneous (Production Model) with the following assumptions: I. Item is sold and consumed at the constant rate which is known. II. Set-up cost is constant and does not change with lot size. III. The increase in inventory is not instantaneous but gradual. [2015/10m/7a(i)]
A contractor undertakes to supply diesel engines to a truck manufacturer at the rate of ₹ 25 per day. Cost of holding a completed engine in stock is ₹ 16/month. Production of engines is undertaken in batches. Each time a new batch is started, a set-up cost of ₹ 10,000 is required irrespective of the number of engines produced. How frequently should the batches be started and what will be the minimum average inventory cost and production time, if the production rate is 40 engines/day? Assume 300 working days in a year. [2015/10m/7a(ii)]
Will Just-In-Time (JIT) work in service requirement as well as it works in production environment? Enlist the applications of JIT in service industry. [2015/10m/7c]
Compare the concept of ‘Just-in-Time’ with that of ‘Manufacturing Resource Planning’. A work centre uses Kanban containers which hold 200 parts. To produce enough parts to fill the container 60 minutes are needed. Moving the container to the next work-station and return of empty container takes 120 minutes. There is overall demand rate of 6 units per minute. (i) Calculate the number of containers needed for the system. (ii) What is maximum inventory in the system? (iii) If the setup and runtime to fill the container is reduced to 40 minutes, can the number of containers be reduced? How much will be the inventory in system then? [2014/20m/8a]
What is underlying philosophy behind JIT systems? Briefly describe the characteristics of JIT systems. [2013/10m/5a]
A manufacturer carries stock of an item with an annual demand of 30,000 units. The set-up cost (s) and holding cost (h) are not known precisely, though they vary between and . (i) Calculate EOQ in both conditions. (ii) How sensitive is the optimal Q to s/h ratio? (iii) If s/h doubles or triples, what happens to economic order quantity Q*? [2013/15m/7c]
(i) What is understood by the statement “Process under statistical control”? (ii) State the conditions when the process is considered statistically out of control on the basis of theory of runs? (iii) What is JIT? What are its objectives and key elements? Illustrate in brief the single card Kanban and two card Kanban systems. [2012/30m/7a]
A seasonal fashion item is to be ordered. The acquisition cost is ₹ 300 and the selling price is ₹ 450. If the salvage value after the season is ₹ 150, what should be the order quantity? The probability of demand occurring is known as under:
| Demand items | 100 | 110 | 120 | 130 | 140 | 150 |
| Probability | 0.1 | 0.2 | 0.2 | 0.3 | 0.1 | 0.1 |
[2011/10m/8c]
JIT, Toyota Production System (TPS) and lean operations sustain competitive advantage. Distinguish among the three. Secondly, discuss how effective JIT contributes to competitive advantage. Thirdly, identify three core components of TPS. [2010/30m/8a]
How does inventory level depend on service level? [2009/5m/6b(i)]
4000 spare parts are required annually. A set-up cost of Rs 100 and a carrying cost of 25% per year is charged on the item cost of Rs 320. The production facility is open for 5 days per week and 50 weeks per year. The lead time of this product is 9 days and the standard deviation of the demand is 2 units per day. The company wants to have a 95% service level for this spare part. (1) If the company were using continuous review system (Q-system) of inventory control, compute the order quantity and reorder level. Interpret the results. (2) If the company were using periodic review system (P-system) of inventory control, give the specific decision rule. [2009/15m/6b(ii)]
What is the benefit to the large company of following a JIT policy? [2008/5m/8b]
The daily demand for a product is normally distributed with a mean of 60 and a standard deviation of 7. The source of supply is reliable and maintains a constant lead time of six days. If the cost of placing the order is Rs 10 and annual holding costs are Rs 0.50 per unit, compute the order quantity and reorder point to satisfy 95% of the customers. Given that 95% corresponds to 1.645 standard deviations. [2008/25m/8c]
The store of an oil engine repair shop has ten items whose details are shown in Table below. Apply ABC analysis to items of store. Does it satisfy principle of ABC analysis?
| Part Code | Description | Price Per Unit Rs. | Units/year |
| P01 | Packing stud | 100 | 100 |
| P02 | Tower bolt | 200 | 300 |
| P03 | Hexagonal nut | 50 | 700 |
| P04 | Bush | 300 | 400 |
| P05 | Couplings | 500 | 1000 |
| P06 | Big Bearings | 3000 | 30 |
| P07 | Small Bearings | 1000 | 100 |
| P08 | Fuel Pump | 7000 | 500 |
| P09 | Fixture | 5000 | 105 |
| P10 | Drill bit | 60 | 1000 |
[2007/20m/5c]
(i) What is the objectives of break-even analysis? The cost of producing between 1500 units and 2500 units of a product consists of Rs. 25,000 fixed cost and Rs. 10 per unit variable cost. With the selling price at Rs. 20 per unit, what is the break-even point? Suppose the price per unit was increased to Rs. 25. Illustrate with a neat sketch how does this affect the break-even point. (ii) What are the various purposes of inventory control? According to the economic lot size formula, if the annual requirement for an item is 8,000 units, set up cost are Rs. 20, and the cost of holding the item in inventory is Re. 0.20 per year, what is the economic lot size to order? Supposing the holding cost doubled to Re. 0.40 per year, what is the percentage effect on the order size? [2004/20m/5c]
A materials manager had recently attended a short training programme on materials management. He thought of applying some of the optimization concepts that he had learnt. He picked on one item having code BV 1960 which was essentially a brass valve. From the current records, he found that the average annual demand was for 10,000 valves. The accounting information system revealed that the carrying cost was Rs. 0.40 per valve per year, whereas the ordering cost was Rs. 5.50 per order. The current policy adopted in the company was to order for 400 valves at a time. Is this an optimal policy? What would be the annual savings if the EOQ concept was applied? [2002/30m/8a]
What is a Master Production Schedule? Explain its relationship with Material Planning (MRP), capacity planning and control activities. [2001/20m/5a]
(i) What is an inventory? Explain the salient features of the following inventory models: Deterministic models Probabilistic models Models under uncertainty. (ii) In a deterministic model the ordering cost is Rs. 4500/ order. The cost of each item is Rs. 2500 and carrying cost is 10% per year. If the annual requirement is 10,000 units determine Economic Ordering Quantity (EOQ). If the inventory carrying cost decreases by 10% and ordering cost increases by 10% determine the % change in EOQ. What do you infer? [2001/30m/8a]
The demand for an item in a company is 18,000 units per year. The company can produce these items at the rate of 3000 units per month. The cost of one set-up is Rs. 500. The holding cost is Rs. 0.15 per unit per month. The shortage cost of one unit is Rs. 20 per year. Determine (i) Economic production quantity; (ii) Number of shortages permitted; (iii) The manufacturing time; and (iv) Time between set-ups and maximum inventory level. [1998/30m/8b]
A company has to manufacture 1,50,000 brackets in a year. It orders raw material for the brackets in lots of 40,000 units from a supplier. It costs Rs. 40 to place an order and estimated inventory carrying costs are 20% of the item cost, which is Rs. 0.15. Calculate the variation (in %) in their order quantity from optimal, and what this variation cost. [1996/20m/7a]
4.13] Strategic sourcing and logistics
6 questions
Discuss the various steps used in sourcing of a product or service. Also, mention the name of the factors influencing the sourcing decision. [2022/10m/8c]
A dairy firm has three plants located in a State. The daily milk production at each plant is as follow: Plant 1: 6 million litres Plant 2: 1 million litres Plant 3: 10 million litres Each day, the firm must fulfil the needs of its four distribution centres. The minimum requirement of each centre is as follows: Distribution Centre 1: 7 million litres Distribution Centre 2: 5 million litres Distribution Centre 3: 3 million litres Distribution Centre 4: 2 million litres Cost (in hundreds of rupees) of shipping one million litres from each plant to each distribution centre is given in the following table:
| Plant \ Distribution Centre | ||||
| 2 | 3 | 11 | 7 | |
| 1 | 0 | 6 | 1 | |
| 5 | 8 | 15 | 9 |
Find the initial basic feasible solution for minimum total cost by (i) Least Cost Method, and (ii) Vogel’s Approximation Method. [2015/20m/7b]
A cost matrix is provided, here amount available exceeds the amount required.
| Available | |||||
| 8 | 9 | 3 | 7 | 130 | |
| 3 | 6 | 8 | 4 | 180 | |
| 7 | 5 | 4 | 5 | 240 | |
| 8 | 7 | 2 | 6 | 160 | |
| 5 | 4 | 2 | 9 | 90 | |
| 8 | 4 | 4 | 3 | 120 | |
| Required | 300 | 100 | 150 | 200 |
(i) Using Vogel’s Approximation determine initial feasible solution. Give all assumptions and provide clear steps. (ii) What is total transportation cost? How can this be checked for optimality? Show one step only. [2010/30m/8b]
Sun Ray Transport Corporation (SRTC) ships truck loads of grain from 3 godowns to 4 mills. The supply (in truck loads) and the demand (also in truck loads) together with the unit transportation cost per truck load on different routes are given in the adjoining table. Cost of transportation is given in the north-eastern corner in 100’s of rupees.
| GODOWNS / MILLS | A | B | C | D | SUPPLY |
| P | 10 | 2 | 20 | 11 | 15 |
| Q | 12 | 7 | 9 | 20 | 25 |
| R | 4 | 14 | 16 | 18 | 10 |
| DEMAND | 5 | 15 | 15 | 15 |
(i) What is north-west corner rule? (ii) How do you check for degeneracy? (iii) Design the quantity to be transported from each godowns to different mills, with the objective of cost minimization of transporting. Develop this using Vogel’s approximation (or penalty rating) method (VAM). (iv) How do you check for optimality of the solution? [2003/30m/7b]
Annapurna Freight Company ships freights from 3 warehouses A, B and D to 4 markets P, Q, R and S. The transportation costs / truck load in Rs. and the quantity to be shipped are shown below:
| Warehouses | Market or Destinations: P | Market or Destinations: Q | Market or Destinations: R | Market or Destinations: S | Available in Truck loads |
| A | 6000 | 2000 | 1000 | 3000 | 30 |
| B | 2000 | 4000 | 1000 | 2000 | 50 |
| D | 3000 | 6000 | 5000 | 1000 | 45 |
| Required, in Truck Loads | 20 | 25 | 40 | 40 |
(i) How much should be shipped from each warehouse to each market destination to minimize the transportation cost? (ii) What is the minimum transportation cost? (iii) What is the effect of changing from 2000 to 3000? (iv) When do you use dummies? [1999/30m/7b]
What is the importance of materials management in an integrated heavy industry? Explain briefly the functions of materials management. [1998/20m/200w/5c]
4.14] Scheduling
14 questions
A job shop has four machines () and five jobs (), all available at . Each job has a unique routing. The processing time (hours) and due dates are given below. (i) Define the critical ratio (CR). Compute the CR for each job at and rank them by urgency (lowest CR = highest priority). State which job is the most critical and explain in two sentences why the CR is more informative than the due date or processing time alone. (ii) Apply the shortest processing time (SPT) dispatching rule – at each machine, when free, select the waiting job with the smallest operation time for that machine. Construct a complete Gantt chart. Compute for each job: Completion time , Flow time , Lateness , and Tardiness . Summarise: makespan, mean flow time, total tardiness, maximum tardiness, number of tardy jobs.
| Job | Routing | Total Work | Due Date |
| 21 | 28 | ||
| 20 | 25 | ||
| 20 | 30 | ||
| 21 | 35 | ||
| 20 | 32 |
[2026/20m/6c]
The work processing time and due date of five jobs are given in the following table. These five jobs are to be sequenced as per: (i) First Come First Serve (FCFS) (ii) Earliest Due Date (EDD) (iii) Minimum Slack (SLACK) (iv) Shortest Processing Time (SPT) Which sequencing rule among these four rules will be recommended by you?
| Jobs | Processing Time (days) | Due Date (days) |
| A | 5 | 10 |
| B | 10 | 15 |
| C | 2 | 5 |
| D | 8 | 12 |
| E | 6 | 8 |
[2023/20m/6b]
Five jobs A, B, C, D and E need to be processed on a machine. Processing time (in days) and due date (from now) are given below:
| Jobs | Processing Time (in days) | Due Date (from now) |
| A | 6 | 5 |
| B | 4 | 10 |
| C | 5 | 15 |
| D | 8 | 20 |
| E | 7 | 30 |
Determine the total completion time (in days) for all jobs, average flow time, average number of jobs in system per day and average tardiness using Shortest Processing Time (SPT) rule so as to establish appropriate sequence for processing of jobs. [2021/15m/6a]
Arrange the following jobs on Machine 1 to Machine 5 using the Johnson’s rule of sequencing. The time (in minutes) required by the jobs on these machines are shown in the table given below. Also find the total idle time and completion time of the jobs.
| Jobs | Machine 1 | Machine 2 | Machine 3 | Machine 4 | Machine 5 |
| A | 7 | 5 | 2 | 3 | 9 |
| B | 6 | 6 | 4 | 5 | 10 |
| C | 5 | 4 | 5 | 6 | 8 |
| D | 8 | 3 | 3 | 2 | 5 |
[2019/10m/7c]
There are five jobs each of which must go through machines A, B and C in the order A – B – C. Processing times are as per the following table:
| Job i | Processing Time | Processing Time | Processing Time |
| 1 | 8 | 5 | 4 |
| 2 | 10 | 6 | 9 |
| 3 | 6 | 2 | 8 |
| 4 | 7 | 3 | 6 |
| 5 | 11 | 4 | 5 |
Determine the sequence for the five jobs that will minimize the elapsed time. [2015/10m/5b]
Find the sequence that minimises the total elapsed time required to complete the following jobs. Each job is processed in the order ACB.
Processing times in hours
| Job No. | 1 | 2 | 3 | 4 | 5 |
| Machine A | 5 | 7 | 6 | 9 | 5 |
| Machine B | 3 | 7 | 5 | 6 | 7 |
| Machine C | 2 | 1 | 4 | 5 | 3 |
Determine the sequence of the jobs, makespan and idle time of machines. Illustrate the method of solution and assumptions taken. [2012/10m/6c]
A company uses a decision rule to determine production level in t-th period, as under: where , denote production and forecast for t-th period and A is smoothing constant. (1) Given the information in the table below, find the appropriate production level for period 2 using a smoothing constant of 0.5:
| Period t | Production Level | Forecast |
| 1 | 36000 | |
| 2 | 42000 | |
| 3 | 48000 |
(2) Assuming that actual production for period 2 will be equal to the value as determined in case (1) above, determine the production levels for period 3 using (A) chase, (B) level and (C) intermediate strategies. [2009/10m/7c(i)]
Give the steps for sequencing n jobs through 2 machines for minimum elapsed time. [2009/5m/8c(i)]
A foreman wants to process four different jobs on three machines A, B and C in his shop. The order of machining for all the jobs is fixed, i.e., A, B and C. The processing time for all the jobs are given in the table below:
| Job | Machine A | Machine B | Machine C |
| 1 | 40 | 10 | 10 |
| 2 | 50 | 15 | 5 |
| 3 | 30 | 8 | 15 |
| 4 | 25 | 20 | 10 |
Decide the optimal sequence for the jobs to minimize the elapsed time between start of the first job to completion of the last job. [2009/15m/8c(ii)]
Explain Johnson’s procedure for determining an optimal sequence for processing n items on two machines. Determine the optimal sequence of jobs which minimizes the total elapsed time based on the following information (processing time on machines is given in hours and passing is not allowed):
| Machines | A | B | C | D | E |
| M1 | 5 | 7 | 6 | 9 | 5 |
| M2 | 2 | 1 | 4 | 5 | 3 |
| M3 | 3 | 7 | 5 | 6 | 7 |
[2005/20m/5d]
A company is producing a batch of five components A, O, E, N and L using three machines X, W, M. All these parts are to be produced in the technological order X, M, W machines. The sum of the processing and set-up times, in minutes for these parts in each of these machines are given below:
| Component | X | W | M |
| N | 8 | 5 | 3 |
| A | 4 | 6 | 4 |
| O | 7 | 7 | 3 |
| L | 5 | 8 | 4 |
| E | 6 | 4 | 4 |
(i) Find the sequence in which parts are to be produced to minimize total make span. [2004/10m/7b(i)]
(ii) Are there alternative sequences? [2004/4m/7b(ii)]
(iii) Represent your schedule in the form of a Gantt chart with starting and ending timings. Neglect machine to machine shifting time. [2004/10m/7b(iii)]
(iv) What are the machine utilisation percentages for each machine if no other job is taken till the completion of this batch. [2004/6m/7b(iv)]
What is a Master Production Schedule? Explain its relationship with Material Planning (MRP), capacity planning and control activities. [2001/20m/5a]
(i) List four of the most common priority decision rules applicable to jobs to be completed on one single machine. (ii) Six jobs are to be processed through the preparation and paint shops. The operation times are as follows:
| Job | Preparation time HRS | Paint shop time HRS |
| A | 10 | 5 |
| B | 7 | 4 |
| C | 5 | 7 |
| D | 3 | 8 |
| E | 2 | 6 |
| F | 4 | 3 |
Determine a sequence that will minimize the total completion time. Find the make span time. [2001/30m/8b]
Machine shop of a small-scale entrepreneur consists of several general purpose machines, one each. A batch of 5 jobs from a customer arrives on one evening. Setting and processing times in two machines are given below.
| Jobs in the Batch | Setting and Processing time (in hours): Machine 1 Milling Machine | Setting and Processing time (in hours): Machine 2 Grinding Machine |
| A | 4 | 2 |
| B | 6 | 10 |
| C | 8 | 4 |
| D | 12 | 8 |
| E | 8 | 12 |
(i) In what sequence you will suggest to process them to minimize the make span of batch? (ii) Represent this in the form of a Gantt chart. (iii) Are there alternative sequences (min make span)? (iv) What algorithm you have used for this 2-machine system of batch processing and what is the logic of sequencing? [1999/30m/7a]
4.15] Statistical quality control
31 questions
A production process is monitored using and R charts. Fifteen subgroups of size were inspected. The grand mean mm and the mean range mm. Use the following control chart constants: , , , where is for the chart, and are for the R chart (i) Compute the upper and lower control limits for both the chart and the R chart. (ii) A separate attribute inspection of 20 lots of 200 units each found a total of 184 defective units. Construct a p-chart: compute , upper control limit (UCL-p) and lower control limit (LCL-p). [2026/10m/5d]
A small manufacturing unit produces bolts and the weight of each bolt is measured. The target weight for a bolt is 60 grams. A sample of 5 bolts is taken every day for 30 days. The weight (in grams) for first 5 days is given below:
| Day | Sample 1 (wt. in gm) | Sample 2 (wt. in gm) | Sample 3 (wt. in gm) | Sample 4 (wt. in gm) | Sample 5 (wt. in gm) |
| 1 | 59.8 | 60.2 | 60.0 | 60.1 | 59.9 |
| 2 | 60.1 | 60.3 | 60.2 | 60.0 | 59.8 |
| 3 | 59.7 | 60.0 | 60.1 | 59.9 | 60.2 |
| 4 | 60.0 | 59.8 | 60.2 | 60.1 | 59.9 |
| 5 | 60.2 | 60.3 | 60.1 | 60.0 | 59.9 |
Calculate the control limits for the (X-bar) chart. The constant for a sample size of 5 is 0.577. [2025/20m/8b]
The data for the number of dissatisfied customers in a department store observed for 20 samples of size 300 are shown in the table below. Construct a suitable control chart for the collected data. Any out-of-control situation may be treated as the presence of some assignable cause, accordingly revise the control limits:
| Sample | No. of Dissatisfied Customers | Sample | No. of Dissatisfied Customers |
| 1 | 10 | 11 | 6 |
| 2 | 12 | 12 | 19 |
| 3 | 8 | 13 | 10 |
| 4 | 9 | 14 | 7 |
| 5 | 6 | 15 | 8 |
| 6 | 11 | 16 | 4 |
| 7 | 13 | 17 | 11 |
| 8 | 10 | 18 | 10 |
| 9 | 8 | 19 | 6 |
| 10 | 9 | 20 | 7 |
Management believes that the dissatisfaction rate is 2%, so establish control limits based on this value. Discuss whether the department can meet this goal. What actions would you recommend? [2024/20m/6b]
What are the elements of a quality costing system? How does an organization benefit from a quality costing system? [2024/10m/7c]
Discuss the trade-off between cost and quality considering various costs of conformance and costs of non-conformance. [2023/10m/5c]
The following data represents the results of inspecting 50 units/day of personal computers produced by two processes A and B of a company for the past ten days.
| Sample No. | Process A No. of Non-Conforming Units | Process B No. of Non-Conforming Units |
| 1 | 5 | 8 |
| 2 | 6 | 7 |
| 3 | 7 | 8 |
| 4 | 5 | 9 |
| 5 | 4 | 10 |
| 6 | 6 | 11 |
| 7 | 5 | 15 |
| 8 | 7 | 8 |
| 9 | 9 | 9 |
| 10 | 6 | 7 |
Calculate control limits for both the processes A and B separately and also see if there is need for revision of control limits in any of the processes. The company claims that 5 PCs may be non-conforming at most out of 50 produced. Perform hypothesis tests for each process using Z-distribution to determine whether the claim of the company is valid for both or not. (Use Normal Distribution table) [2023/20m/8a]
A firm has identified four operations, which are to be conducted in succession for an order to be processed. The tolerance and mean time of each operation are given in the following table. Tolerance is independent of each other and the time is normally distributed.
| Operation | Mean Time (hours) | Tolerance (hours) |
| 1 | 7 | |
| 2 | 5 | |
| 3 | 9 | |
| 4 | 6 |
(i) Find the natural tolerance limits for order completion time. (ii) If the company sets a goal of 27.5 hours, what proportion of the orders will fail to satisfy the goal? (iii) Find an appropriate capability index and comment. (iv) Using a technique, management has improved the operation 3 to a mean time of 8 hours. What proportion of the orders will now meet the goal? (Use Standard Normal Distribution table given on the last page) [2022/20m/7a]
A car servicing company is interested in reducing the waiting time for its customers. They select four customers randomly each day and find the waiting time for each customer while his/her car is serviced. From these observations, the sample average and range are found. This process is repeated for 25 days. The summary data for these observations are as under: (i) Find out and R chart control limits. (ii) Assuming that the process is in control and the distribution of waiting time is normal, find the percentage of customers who will not have to wait for more than 50 minutes. (iii) Find the control limits. (Factors for Computing Centerline and Three-Sigma Control Limits and Cumulative Standard Normal Distribution table are appended in the question paper) [2021/15m/7a]
(i) Differentiate the applications of control charts for variables and control charts for attributes. (ii) Define the term Process Capability Index and show the range of values of capability index for process under control and out of control showing the relationship with specification limits and process spread. [2019/10m/5c]
Quality control department of a tire manufacturing plant has inspected the number of defective tires in twenty random samples with twenty observations each. Following are the number of defective tires found in each sample:
| Sample Number | Number of defective tires | Number of observations sampled | Fraction defectives |
| 1 | 3 | 20 | 0.15 |
| 2 | 2 | 20 | 0.10 |
| 3 | 1 | 20 | 0.05 |
| 4 | 2 | 20 | 0.10 |
| 5 | 1 | 20 | 0.05 |
| 6 | 3 | 20 | 0.15 |
| 7 | 3 | 20 | 0.15 |
| 8 | 2 | 20 | 0.10 |
| 9 | 1 | 20 | 0.05 |
| 10 | 2 | 20 | 0.10 |
| 11 | 3 | 20 | 0.15 |
| 12 | 2 | 20 | 0.10 |
| 13 | 2 | 20 | 0.10 |
| 14 | 1 | 20 | 0.05 |
| 15 | 1 | 20 | 0.05 |
| 16 | 2 | 20 | 0.10 |
| 17 | 4 | 20 | 0.20 |
| 18 | 3 | 20 | 0.15 |
| 19 | 1 | 20 | 0.05 |
| 20 | 1 | 20 | 0.05 |
Construct a P-chart 3 standard deviation [three sigma control chart (Z = 3)]. [2018/20m/8a]
A car manufacturer performs final inspection before shipping to the dealers. The final inspection involves testing and inspection of car with regard to number of parameters. There is a possibility that a car may fail to satisfy various parameters (which can be termed as defects). Periodically ten (10) cars were taken randomly for testing and inspection. Data obtained after inspection and testing of each car with regard to number of defects is given below. Determine the control limits for C chart and comment:
| Sample/Car | 1 | 2 | 3 | 4 | 5 | 6 | 7 | 8 | 9 | 10 |
| No. of defects | 10 | 12 | 13 | 08 | 09 | 10 | 12 | 20 | 07 | 06 |
[2017/15m/8b]
The following table shows the averages () and ranges (R) of the spindle diameters in mm for 30 sub-groups of 5 items each taken from a production line chronologically:
| Sub-group | R | Sub-group | R | Sub-group | R | |||
| 1 | 45.020 | 0.375 | 11 | 45.600 | 0.275 | 21 | 45.260 | 0.150 |
| 2 | 44.950 | 0.450 | 12 | 45.020 | 0.175 | 22 | 45.650 | 0.200 |
| 3 | 45.480 | 0.450 | 13 | 45.320 | 0.200 | 23 | 45.620 | 0.400 |
| 4 | 45.320 | 0.150 | 14 | 45.560 | 0.425 | 24 | 45.480 | 0.225 |
| 5 | 45.280 | 0.200 | 15 | 45.140 | 0.250 | 25 | 45.380 | 0.125 |
| 6 | 45.820 | 0.250 | 16 | 45.620 | 0.375 | 26 | 45.660 | 0.350 |
| 7 | 45.580 | 0.275 | 17 | 45.800 | 0.475 | 27 | 45.460 | 0.225 |
| 8 | 45.400 | 0.475 | 18 | 45.500 | 0.200 | 28 | 45.640 | 0.375 |
| 9 | 45.600 | 0.475 | 19 | 45.780 | 0.275 | 29 | 45.390 | 0.650 |
| 10 | 45.680 | 0.275 | 20 | 45.640 | 0.225 | 30 | 45.290 | 0.350 |
Construct and R-charts on the basis of the first 20 sub-groups. Check if the process continues under control for the remaining sub-groups (i.e., 21 to 30). What do you conclude? Find the process capability. The value of for a sample of 5 is 2.326. [2016/20m/7c]
A company studied the cost data on quality and found a relationship between the percent defective and the cost of control and cost of failure per 100 parts as under: Cost of failure Cost of Control where X is percent defective. What is the percent defective which minimizes the quality cost? How much is the minimum quality cost per hundred parts? [2014/10m/5c]
What is understood by “process is under statistical control”? Explain clearly with the help of diagrams, illustrating out of control situations. Plot the control charts of and R, using the following sample data and a sample size of 5. From the chart, find out whether the process is under control.
| Subgroup No. | 1 | 2 | 3 | 4 | 5 | 6 | 7 | 8 | 9 | 10 |
| 5.004 | 5.204 | 5.014 | 5.008 | 5.009 | 5.016 | 5.030 | 5.010 | 5.016 | 5.010 | |
| R | 0.02 | 0.08 | 0.03 | 0.05 | 0.04 | 0.09 | 0.04 | 0.04 | 0.05 | 0.07 |
The factors for estimating from R and from statistical tables are reproduced below:
| Number of observations n | 2 | 3 | 4 | 5 | 6 | 7 | 8 | 9 | 10 | 11 |
| 1.128 | 1.693 | 2.059 | 2.326 | 2.534 | 2.704 | 2.847 | 2.970 | 3.078 | 3.173 | |
| 0.5642 | 0.7236 | 0.7979 | 0.8407 | 0.8686 | 0.8882 | 0.9027 | 0.9139 | 0.9227 | 0.9300 |
[2014/20m/8b]
A special screw is being produced on a machine. The diameter of screw is critical and the process is to be controlled. Twelve samples of four screws each are drawn chronologically and inspected. The data is tabulated below:
| Sample No. | Screw Diameter (mm) 1 | Screw Diameter (mm) 2 | Screw Diameter (mm) 3 | Screw Diameter (mm) 4 |
| 1 | 12.50 | 12.56 | 12.51 | 12.49 |
| 2 | 12.55 | 12.52 | 12.51 | 12.56 |
| 3 | 12.58 | 12.55 | 12.54 | 12.50 |
| 4 | 12.53 | 12.55 | 12.56 | 12.52 |
| 5 | 12.54 | 12.53 | 12.51 | 12.59 |
| 6 | 12.50 | 12.48 | 12.53 | 12.60 |
| 7 | 12.52 | 12.53 | 12.51 | 12.55 |
| 8 | 12.55 | 12.51 | 12.58 | 12.59 |
| 9 | 12.53 | 12.54 | 12.51 | 12.58 |
| 10 | 12.56 | 12.53 | 12.55 | 12.56 |
| 11 | 12.55 | 12.54 | 12.54 | 12.57 |
| 12 | 12.60 | 12.55 | 12.54 | 12.58 |
The statistical control chart constants for some samples are as under:
| No. of observations in sample n | Chart for Average – Factors for Control Limits | Factor for central line | Chart for ranges of Factors for Control Limits | |||||
| 2 | 2.121 | 3.759 | 1.880 | 1.128 | 0.0 | 3.686 | 0.0 | 3.268 |
| 3 | 1.732 | 2.394 | 1.023 | 1.693 | 0.0 | 4.358 | 0.0 | 2.574 |
| 4 | 1.500 | 1.880 | 0.729 | 2.059 | 0.0 | 4.698 | 0.0 | 2.282 |
| 5 | 1.342 | 1.596 | 0.577 | 2.326 | 0.0 | 4.918 | 0.0 | 2.114 |
Is the process under statistical control? Justify your answer. [2013/20m/8a]
(i) What is understood by the statement “Process under statistical control”? (ii) State the conditions when the process is considered statistically out of control on the basis of theory of runs? (iii) What is JIT? What are its objectives and key elements? Illustrate in brief the single card Kanban and two card Kanban systems. [2012/30m/7a]
(i) Identify four major costs associated with poor quality. (ii) Name the tools for improving quality. (iii) The operations and their reliabilities for a beauty-product are given below:
| Operation | Reliability |
| Mix | 0.99 |
| Fill | 0.98 |
| Cap | 0.99 |
| Label | 0.97 |
What is the reliability of the system? (iv) The feedback from customers shows the following:
| Defect | Frequency |
| Lumps of un-mixed product | 7 |
| Over or underfilled jars | 18 |
| Jar lids did not seal | 6 |
| Labels rumpled or missing | 29 |
Draw the Pareto chart to identify vital defects. [2011/10m/5f]
Determine the trial central line and control limits for a p chart using the following data, which are for the payment of dental insurance claims. Plot the values on graph paper and determine if the process is stable. If there are any out-of-control points, assume an assignable cause and determine the revised central line and control limits.
| Subgroup Number | Number Inspected | Number Nonconforming | Subgroup Number | Number Inspected | Number Nonconforming |
| 1 | 300 | 3 | 14 | 300 | 6 |
| 2 | 300 | 6 | 15 | 300 | 7 |
| 3 | 300 | 4 | 16 | 300 | 4 |
| 4 | 300 | 6 | 17 | 300 | 5 |
| 5 | 300 | 20 | 18 | 300 | 7 |
| 6 | 300 | 2 | 19 | 300 | 5 |
| 7 | 300 | 6 | 20 | 300 | 0 |
| 8 | 300 | 7 | 21 | 300 | 2 |
| 9 | 300 | 3 | 22 | 300 | 3 |
| 10 | 300 | 0 | 23 | 300 | 6 |
| 11 | 300 | 6 | 24 | 300 | 1 |
| 12 | 300 | 9 | 25 | 300 | 8 |
| 13 | 300 | 5 |
[2010/15m/7b(i)]
Determine the trial limits and revised control limits for a u chart using the data in the table for the surface finish of rolls of white paper. Assume any out-of-control points have assignable causes.
| Lot Number | Sample Size | Total Nonconformities | Lot Number | Sample Size | Total Nonconformities |
| 1 | 10 | 45 | 15 | 10 | 48 |
| 2 | 10 | 51 | 16 | 11 | 35 |
| 3 | 10 | 36 | 17 | 10 | 39 |
| 4 | 9 | 48 | 18 | 10 | 29 |
| 5 | 10 | 42 | 19 | 10 | 37 |
| 6 | 10 | 5 | 20 | 10 | 33 |
| 7 | 10 | 33 | 21 | 10 | 15 |
| 8 | 8 | 27 | 22 | 10 | 33 |
| 9 | 8 | 31 | 23 | 11 | 27 |
| 10 | 8 | 22 | 24 | 10 | 23 |
| 11 | 12 | 25 | 25 | 10 | 25 |
| 12 | 12 | 35 | 26 | 10 | 41 |
| 13 | 12 | 32 | 27 | 9 | 37 |
| 14 | 10 | 43 | 28 | 10 | 28 |
In both cases assume limit. [2010/15m/7b(ii)]
The following costs were incurred in a year in a company. Classify them into various quality costs.
| Sl. No. | Head | Cost (Rs) |
| 1 | Incoming material inspection | 20,000 |
| 2 | Training of personnel | 40,000 |
| 3 | Warranty | 45,000 |
| 4 | Process planning | 15,000 |
| 5 | Scrap | 13,000 |
| 6 | Quality laboratory | 30,000 |
| 7 | Rework | 25,000 |
| 8 | Allowances | 10,000 |
| 9 | Complaints | 14,000 |
[2009/8m/5d(ii)]
(i) In statistical quality control, which would be the more sensitive control limits, or ? (ii) A manufacturer likes to prepare a statistical quality control chart for the number of mounting bracket hole discrepancies in the power supply chassis of a TV set. Twenty samples of size 200 have been taken and discrepancies are as follows:
| Sample number | Number of discrepancies | Sample number | Number of discrepancies |
| 1 | 11 | 11 | 5 |
| 2 | 7 | 12 | 7 |
| 3 | 4 | 13 | 9 |
| 4 | 1 | 14 | 5 |
| 5 | 5 | 15 | 17 |
| 6 | 13 | 16 | 18 |
| 7 | 6 | 17 | 9 |
| 8 | 5 | 18 | 5 |
| 9 | 3 | 19 | 7 |
| 10 | 0 | 20 | 0 |
Determine the preliminary control limits. Construct the control chart. Plot the twenty samples. Is the process under control? [2008/20m/5d]
A company makes 16 gm toffees (net weight) for sale. As policy, a toffee is considered unacceptable if the net weight is more than 0.1 gm greater or less than this amount. The company took 20 samples of five toffees each (100 in total) from production line when the process was known to be in control. The average weight for 100 toffees was 16.003 gm and the average range for the 20 samples was 0.093 gm. (i) Compute the upper and lower limits for three sigma -chart. (ii) Compute the upper and lower limits for three sigma R-chart. (iii) Based on (i) and (ii), suppose the company now samples 5 toffees from the production line. The net weight of thee toffees are 16.018, 15.870, 16.115, 16.002 and 16.005 gm. Determine whether or not the process is in control. If not, specify what the problem is and how you determined this. [Given that for sample size of 5, ; For R chart and where and ]. [2006/20m/8b]
Samples of n = 8 items each are taken from a manufacturing process at regular intervals. A quality characteristic is measured, and and R values are calculated for each sample. After 50 samples, we have ; and Assume that the quality characteristic is normally distributed. (i) Compute control limits for the and R control charts. (ii) All points on both control charts fall between the control limits computed in part (i). What are the natural tolerance limits of the process? (iii) If the specification limits are 41 ± 5.0, what are your conclusions regarding the ability of the process to produce items within these specifications? (iv) Assuming that if an item exceeds the upper specification limit it can be reworked, and if it is below the lower specification limit it must be scrapped, what percent scrap and rework is the process producing? (v) Make suggestions as to how the process performance can be improved.
[Figure: Statistical tables printed with the paper (four pages): (1) “Cumulative distribution function for the standard normal distribution (SND)” – sketch of the N(0, 1) curve with the area to the left of z shaded, note “For the SND, the table gives the cdf value at z, that is ”, tabulated for z = –3.5 to +3.5 in steps of 0.1 (columns 0.00 to 0.09); (2) “Factors for constructing variables control charts” – chart for averages (factors , , ), chart for standard deviations (factors , , , , , ) and chart for ranges (factors , , , , , , ) for n = 2 to 25, with the formulae for n > 25.] [2005/30m/7a]
What do you understand by quality control by attributes and quality control by variables? [2004/5m/7a(i)]
Where do you need a larger sample size in the above and why? [2004/5m/7a(ii)]
Four batches of products are inspected at 90 minute intervals and their percentage difference in weights from the nominal are given below: Percentage difference on weights in sample.
| Batch-1 | Batch-2 | Batch-3 | Batch-4 |
| 1.2 | 0.6 | 0.6 | 2.1 |
| 1.8 | 0.3 | 1.5 | 0.6 |
| 1.5 | 0.3 | 1.0 | 0.6 |
| 0.9 | 0.0 | 0.0 | 2.7 |
| 0.3 | 0.6 | 1.9 | 2.7 |
Assume that normal process average variation is 0.9% and process standard deviation is 0.5%, range U.C.L. is 5 times S.D. Plot , R chart indicating the various control limits. Is the process under control? [2004/20m/7a(iii)]
What do you understand by inspection of attributes and inspection of variables? In which case the sample size (for the same confidence level) is more and why? Weight of pineapple cans with fruit and juice is measured in kg from a continuous production run. Every day a sample of 4 cans are picked up at random and weighed. The data so collected are given in the following table. Plot the and R charts with their control limits. What is your observation of behavior? What suggestions you wish to make for a proper control of the process?
| DAY | 1 | 2 | 3 | 4 |
| Day-1 | 1.20 | 1.24 | 1.25 | 1.25 |
| Day-2 | 1.24 | 1.28 | 1.28 | 1.14 |
| Day-3 | 1.10 | 1.20 | 1.26 | 1.26 |
| Day-4 | 1.18 | 0.98 | 1.18 | 1.16 |
Constant A for control limits of = 0.729 B for control limits of R = 2.282 [2003/30m/8a]
A person operates a machine that makes capacitors. He has been advised to keep track of the percent defectives at his work centre. He knows that with this type of process, they expect about 4% defectives plus or minus some chance variation. He wishes to initially construct a control chart for defectives. He has prepared ten daily samples of hundred capacitors each.
| Sample Number | 1 | 2 | 3 | 4 | 5 | 6 | 7 | 8 | 9 | 10 |
| % defectives | 4 | 3 | 3 | 6 | 1 | 9 | 5 | 12 | 4 | 3 |
(i) Construct the relevant control chart. What are the upper and lower control limits? (ii) Plot the data points on the proposed control chart. Is the process under control? What follow up steps should be undertaken, if any? [2002/30m/7b]
A process was set to produce rivets of 10 mm length. The first 32 pieces made by the process were found to have the following lengths (in mm) 9.9, 10.0, 10.0, 9.9, 9.9, 9.9, 10.0, 10.0, 10.1, 10.1, 10.0, 10.0, 9.9, 10.1, 10.1, 9.9, 9.9, 10.1, 10.0, 10.1, 10.0, 9.9, 9.9, 9.9, 10.1, 10.0, 10.0, 10.1, 10.0, 10.0, 10.0, (i) Plot and R control chart for the process, taking data for , and from the following table.
| No. of observations in the sample | 2 | 3 | 4 | 5 | 6 |
| 1.88 | 1.023 | 0.729 | 0.577 | 0.483 | |
| 0 | 0 | 0 | 0 | 0 | |
| 3.276 | 2.575 | 2.282 | 2.115 | 2.004 |
(ii) If the process is not under statistical control, discuss what steps should be taken to make the control chart viable? [2000/20m/5c]
(i) What all costs result from poor quality of component production? (ii) How the concept of internal customer and external customer has improved quality manyfold? (iii) How quality productivity, cost, market share, profit and scale of production are related qualitatively? (iv) What is Deming’s Award for quality? Has any Indian firm been awarded this recently? [1999/20m/200w/5a]
Distinguish between Quality Control and Quality Assurance with particular reference manufacturing. Which is done first and why? [1996/20m/200w/5d]
4.16] Project management
11 questions
The time estimates in weeks for the activities of a PERT network are given in the table below:
| Activity | Optimistic time () | Most likely time () | Pessimistic time () |
| 1 – 2 | 1 | 1 | 7 |
| 1 – 3 | 2 | 5 | 8 |
| 1 – 4 | 2 | 2 | 8 |
| 3 – 5 | 3 | 6 | 15 |
| 4 – 5 | 1 | 4 | 7 |
| 5 – 6 | 2 | 5 | 14 |
| 2 – 6 | 2 | 5 | 8 |
(i) Draw network diagram and determine project completion time. (ii) Find the probability that the project will be finished in between 15th to 20th week of the scheduled completion. (iii) Find the probability that the project will be finished no more than 2 weeks later than the expected completion time. (The standard normal distribution chart is given in the question)
AREAS UNDER THE STANDARD NORMAL PROBABILITY DISTRIBUTION. Values in the table represent the proportion of area under the normal curve between the mean () and a positive value of z.
[Figure: Normal curve with the area between 0 and z shaded]
| z | .00 | .01 | .02 | .03 | .04 | .05 | .06 | .07 | .08 | .09 |
| 0.0 | 0.0000 | 0.0040 | 0.0080 | 0.0120 | 0.0160 | 0.0199 | 0.0239 | 0.0279 | 0.0319 | 0.0359 |
| 0.1 | 0.0398 | 0.0438 | 0.0478 | 0.0517 | 0.0557 | 0.0596 | 0.0636 | 0.0675 | 0.0714 | 0.0753 |
| 0.2 | 0.0793 | 0.0832 | 0.0871 | 0.0910 | 0.0948 | 0.0987 | 0.1026 | 0.1064 | 0.1103 | 0.1141 |
| 0.3 | 0.1179 | 0.1217 | 0.1255 | 0.1293 | 0.1331 | 0.1368 | 0.1406 | 0.1443 | 0.1480 | 0.1517 |
| 0.4 | 0.1554 | 0.1591 | 0.1628 | 0.1664 | 0.1700 | 0.1736 | 0.1772 | 0.1808 | 0.1844 | 0.1879 |
| 0.5 | 0.1915 | 0.1950 | 0.1985 | 0.2019 | 0.2054 | 0.2088 | 0.2123 | 0.2157 | 0.2190 | 0.2224 |
| 0.6 | 0.2257 | 0.2291 | 0.2324 | 0.2357 | 0.2389 | 0.2422 | 0.2454 | 0.2486 | 0.2517 | 0.2549 |
| 0.7 | 0.2580 | 0.2611 | 0.2642 | 0.2673 | 0.2703 | 0.2734 | 0.2764 | 0.2794 | 0.2823 | 0.2852 |
| 0.8 | 0.2881 | 0.2910 | 0.2939 | 0.2967 | 0.2995 | 0.3023 | 0.3051 | 0.3078 | 0.3106 | 0.3133 |
| 0.9 | 0.3159 | 0.3186 | 0.3212 | 0.3238 | 0.3264 | 0.3289 | 0.3315 | 0.3340 | 0.3365 | 0.3389 |
| 1.0 | 0.3413 | 0.3438 | 0.3461 | 0.3485 | 0.3508 | 0.3531 | 0.3554 | 0.3577 | 0.3599 | 0.3621 |
| 1.1 | 0.3643 | 0.3665 | 0.3686 | 0.3708 | 0.3729 | 0.3749 | 0.3770 | 0.3790 | 0.3810 | 0.3830 |
| 1.2 | 0.3849 | 0.3869 | 0.3888 | 0.3907 | 0.3925 | 0.3944 | 0.3962 | 0.3980 | 0.3997 | 0.4015 |
| 1.3 | 0.4032 | 0.4049 | 0.4066 | 0.4082 | 0.4099 | 0.4115 | 0.4131 | 0.4147 | 0.4162 | 0.4177 |
| 1.4 | 0.4192 | 0.4207 | 0.4222 | 0.4236 | 0.4251 | 0.4265 | 0.4279 | 0.4292 | 0.4306 | 0.4319 |
| 1.5 | 0.4332 | 0.4345 | 0.4357 | 0.4370 | 0.4382 | 0.4394 | 0.4406 | 0.4418 | 0.4429 | 0.4441 |
| 1.6 | 0.4452 | 0.4463 | 0.4474 | 0.4484 | 0.4495 | 0.4505 | 0.4515 | 0.4525 | 0.4535 | 0.4545 |
| 1.7 | 0.4554 | 0.4564 | 0.4573 | 0.4582 | 0.4591 | 0.4599 | 0.4608 | 0.4616 | 0.4625 | 0.4633 |
| 1.8 | 0.4641 | 0.4649 | 0.4656 | 0.4664 | 0.4671 | 0.4678 | 0.4686 | 0.4693 | 0.4699 | 0.4706 |
| 1.9 | 0.4713 | 0.4719 | 0.4726 | 0.4732 | 0.4738 | 0.4744 | 0.4750 | 0.4756 | 0.4761 | 0.4767 |
| 2.0 | 0.4772 | 0.4778 | 0.4783 | 0.4788 | 0.4793 | 0.4798 | 0.4803 | 0.4808 | 0.4812 | 0.4817 |
| 2.1 | 0.4821 | 0.4826 | 0.4830 | 0.4834 | 0.4838 | 0.4842 | 0.4846 | 0.4850 | 0.4854 | 0.4857 |
| 2.2 | 0.4861 | 0.4864 | 0.4868 | 0.4871 | 0.4875 | 0.4878 | 0.4881 | 0.4884 | 0.4887 | 0.4890 |
| 2.3 | 0.4893 | 0.4896 | 0.4898 | 0.4901 | 0.4904 | 0.4906 | 0.4909 | 0.4911 | 0.4913 | 0.4916 |
| 2.4 | 0.4918 | 0.4920 | 0.4922 | 0.4925 | 0.4927 | 0.4929 | 0.4931 | 0.4932 | 0.4934 | 0.4936 |
| 2.5 | 0.4938 | 0.4940 | 0.4941 | 0.4943 | 0.4945 | 0.4946 | 0.4948 | 0.4949 | 0.4951 | 0.4952 |
| 2.6 | 0.4953 | 0.4955 | 0.4956 | 0.4957 | 0.4959 | 0.4960 | 0.4961 | 0.4962 | 0.4963 | 0.4964 |
| 2.7 | 0.4965 | 0.4966 | 0.4967 | 0.4968 | 0.4969 | 0.4970 | 0.4971 | 0.4972 | 0.4973 | 0.4974 |
| 2.8 | 0.4974 | 0.4975 | 0.4976 | 0.4977 | 0.4977 | 0.4978 | 0.4979 | 0.4979 | 0.4980 | 0.4981 |
| 2.9 | 0.4981 | 0.4982 | 0.4982 | 0.4983 | 0.4984 | 0.4984 | 0.4985 | 0.4985 | 0.4986 | 0.4986 |
| 3.0 | 0.4987 | 0.4987 | 0.4987 | 0.4988 | 0.4988 | 0.4989 | 0.4989 | 0.4989 | 0.4990 | 0.4990 |
[2019/20m/8b]
(i) What statistical assumptions are made in PERT? If a particular activity has a very high variance in PERT chart, how will this affect the completion time? (ii) A list of activities, precedence relations, and optimistic (), most likely () and pessimistic () activity completion times for a secret military project are given below:
| Activity Name | Predecessor Activity | Estimated Time in Days | Estimated Time in Days | Estimated Time in Days |
| A | – | 4 | 5 | 6 |
| B | A | 3 | 4 | 8 |
| C | B | 1 | 2 | 3 |
| D | A, C | 3 | 6 | 8 |
| E | D | 7 | 8 | 9 |
| F | E | 4 | 5 | 7 |
| G | C | 3 | 4 | 5 |
| H | D, E, G, I | 12 | 13 | 15 |
| I | C | 1 | 2 | 4 |
| J | G, H | 1 | 1 | 1 |
| K | F, H, J | 1 | 6 | 7 |
Draw the activity network diagram for this project. What is the critical path for the project? What is the probability that the project will be completed (1) in 45 days, and (2) in 50 days? [ The areas under the standard normal probability distribution is attached ] [2016/20m/6c]
Define ‘slack’. [2009/5m/7b(i)]
A project consists of six activities. The precedence relationship of activities and the three time estimates of completion of activities in days are tabulated below:
| Sl. No. | Activity | Immediate Precedent Activity | Optimistic (days) | Pessimistic (days) | Most likely (days) |
| 1 | A | – | 0.5 | 1.5 | 1.00 |
| 2 | B | A | 1.0 | 3.0 | 2.00 |
| 3 | C | B | 2.0 | 2.0 | 2.00 |
| 4 | D | A | 2.9 | 4.1 | 2.75 |
| 5 | E | A | 1.5 | 4.0 | 1.63 |
| 6 | F | C, D, E | 3.0 | 6.0 | 3.75 |
(1) Draw the arrow diagram. (2) Which of the six activities is most uncertain? (3) What is the probability that the project will be completed within 10 days? Refer the SND-chart (Cumulative Distribution Function for the Standard Normal Distribution) attached at the end. [2009/15m/7b(ii)]
The project network for manufacturing a product is given below with seven events (A-G) and eight activities. The estimates of optimistic, most likely and pessimistic times in days are shown as ––, in that order, for each activity:
[Figure: Project network (events as circles). Activities with ––: A → C: 6-8-10; A → D: 3-5-7; A → B: 8-11-14; C → E: 3-4-5; D → E: 2-5-8; E → F: 0-0-0 (dummy); B → F: 0-0-0 (dummy); F → G: 4-6-8. A is the start event and G the end event.]
(i) Determine the slack time for each activity. (ii) Find the critical path. (iii) Find the earliest possible project completion time. [2008/30m/7b]
Following data refers to gas pipe project:
| Activity | Predecessor | Optimistic time, a (weeks) | Most likely time, m (weeks) | Pessimistic time, b (weeks) |
| A | – | 3 | 5 | 8 |
| B | – | 6 | 7 | 9 |
| C | A | 4 | 5 | 9 |
| D | B | 3 | 5 | 8 |
| E | A | 4 | 6 | 9 |
| F | C, D | 5 | 8 | 11 |
| G | C, D, E | 3 | 6 | 9 |
| H | F | 1 | 2 | 9 |
(i) Construct Project network. (ii) Find the expected duration and variance of each activity. (iii) Find the critical path and expected project completion time. (iv) What is the probability of completing the project on or before 30 weeks? [2007/30m/7b]
A project is composed of eleven activities. The time estimates are given below:
| Activity | |||
| 1 – 2 | 7 | 17 | 9 |
| 1 – 3 | 10 | 60 | 20 |
| 1 – 4 | 5 | 15 | 10 |
| 2 – 5 | 50 | 110 | 65 |
| 2 – 6 | 30 | 50 | 40 |
| 3 – 6 | 50 | 90 | 55 |
| 3 – 7 | 1 | 9 | 5 |
| 4 – 7 | 40 | 68 | 48 |
| 5 – 8 | 5 | 15 | 10 |
| 6 – 8 | 20 | 52 | 27 |
| 7 – 8 | 30 | 50 | 40 |
(i) Draw the network diagram of project. (ii) Calculate slack time for each node. (iii) Determine critical path. [2006/30m/7b]
A plant start up of activities are based on the following sequences:
| Activity | Immediate predecessor | Normal time (weeks) | Normal cost (Rs) | Possible crash time (weeks) | Crashed cost (Rs) |
| A | – | 4 | 1,000 | 2 | 1,500 |
| B | – | 8 | 800 | 2 | 1,400 |
| C | – | 2 | 400 | 1 | 600 |
| D | A | 3 | 800 | 2 | 1,200 |
| E | A | 5 | 800 | 3 | 1,400 |
| F | C | 5 | 600 [?] | 1 | 1,000 |
| G | H, D [?] | 6 | 1,200 | 2 | 1,600 |
(i) Draw the network for this project and label the activities and dummies. (ii) Identify the critical path. (iii) What is the normal project completion time and cost? (iv) How much it will cost to crash the project completion by 2 weeks; by 3 weeks? (Assume crashing cost is proportional to time). (v) What is cost over-run and time over-run, and which is worse? [1999/30m/8a]
Consider the following schedule of activities and related information for construction of a new International Airport.
| Activity | Expected Time: Months | Expected Time: Variance | Expected Cost: Rupees [?] |
| 1 – 2 | 4 | 1 | 5 |
| 2 – 3 | 2 | 1 | 3 |
| 3 – 6 | 3 | 1 | 4 |
| 2 – 4 | 6 | 2 | 9 |
| 1 – 5 | 2 | 1 | 2 |
| 5 – 6 | 5 | 1 | 12 |
| 4 – 6 | 9 | 5 | 20 |
| 5 – 7 | 7 | 8 | 7 |
| 7 – 8 | 10 | 16 | 14 |
| 6 – 8 | 1 | 1 | 4 |
Assume that the cost and time required for one activity are not dependent upon the cost and time of any other activity and variations are expected to follow a normal distribution. Find: (i) the critical path; (ii) the expected cost of construction of the airport; (iii) the expected time required to build the airport; and (iv) the standard deviation of the expected time [1998/30m/8a]
A network is shown below (Fig2) in which A, B, C, D, E, F, and G are the activities having the durations 5, 4, 8, 5, 5, 4, and 9 respectively (i) Calculate the earliest start time, earliest finish time, latest start time, latest finish time and total slack for each activity using a deadline of 20 days for project completion. (ii) Indicate the critical path and its completion time.
[Figure: Fig-2, activity-on-arrow network; only the start node O is labelled. From O three activities leave: E,5 (upper), F,4 (middle) and G,9 (lower). A,5 follows E; B,4 follows F; A and B end at the same node, from which D,5 runs to the final node; C,8 follows G and also ends at the final node] [1997/30m/6b]
Consider a project with following precedence requirements and estimated times:
| Activity | Time in weeks | Immediate Predecessor |
| A | 3 | – |
| B | 5 | – |
| C | 7 | – |
| D | 3 | C |
| E | 7 | A, B |
| F | 3 | E, D |
| G | 2 | D |
| H | 2 | F, G |
Draw the CPM network and find the critical path. [1996/20m/8b]
4.17] System improvement
17 questions
In an organization, what do you understand by the roles of flexibility, lean practices and agility? Explain how flexibility, lean practices and agility are complementary approaches. [2026/15m/7b]
What are the key features of Total Quality Management to improve customer satisfaction through design, manufacture and delivery of quality products? [2023/10m/7c]
Write the contributions of Walter A. Shewhart, W. Edwards Deming, Joseph M. Juran, Philip B. Crosby, and K. Ishikawa in the area of quality management. [2022/10m/6c]
How do lean systems function? What are the characteristics of lean systems? Also, discuss the benefits and risks of lean systems. [2021/15m/7b]
What are the advantages and limitations of lean manufacturing? Discuss the difficulties in adopting lean technique. [2020/10m/8c]
(i) Write the major components of TQM philosophy. (ii) How do you incorporate the seasonal variations in demand forecasting? [2019/10m/5e]
Explain the term “Total Quality Management (TQM)”. [2018/15m/8b]
Describe the philosophy of lean management including waste and value stream with regard to manufacturing. [2017/10m/5d]
(i) List the basic concepts of TQM. (ii) List any five conventional QC tools. [2016/10m/5d]
(i) State the basic principles of lean production. (ii) Compare lean production with mass production. [2016/10m/5e]
(i) Identify four major costs associated with poor quality. (ii) Name the tools for improving quality. (iii) The operations and their reliabilities for a beauty-product are given below:
| Operation | Reliability |
| Mix | 0.99 |
| Fill | 0.98 |
| Cap | 0.99 |
| Label | 0.97 |
What is the reliability of the system? (iv) The feedback from customers shows the following:
| Defect | Frequency |
| Lumps of un-mixed product | 7 |
| Over or underfilled jars | 18 |
| Jar lids did not seal | 6 |
| Labels rumpled or missing | 29 |
Draw the Pareto chart to identify vital defects. [2011/10m/5f]
Why is Total Quality Management (TQM) important? What are the benefits that can be obtained by applying TQM in the software industries? What are the principles of TQM in such applications? [2010/12m/5e]
JIT, Toyota Production System (TPS) and lean operations sustain competitive advantage. Distinguish among the three. Secondly, discuss how effective JIT contributes to competitive advantage. Thirdly, identify three core components of TPS. [2010/30m/8a]
What is value analysis and in what way it is different from conventional cost reduction techniques? How can the value be increased? Discuss a value analysis programme, step by step, for improving a product viz. “BALL POINT PEN”. Can this technique be applied to service activities? [2003/20m/5c]
(i) What all costs result from poor quality of component production? (ii) How the concept of internal customer and external customer has improved quality manyfold? (iii) How quality productivity, cost, market share, profit and scale of production are related qualitatively? (iv) What is Deming’s Award for quality? Has any Indian firm been awarded this recently? [1999/20m/200w/5a]
What do you understand by value engineering? Explain the importance of human dynamics in value engineering. [1998/20m/200w/5d]
Define Value Engineering and explain its role in a manufacturing enterprise. List down the questions which need to be answered when carrying out value analysis for a product. Take a suitable example to illustrate your reply. [1996/20m/8c]

Strengthen your GS papers
Our UPSC Mains Topic-wise & Year-wise PYQ eBook (2013–2026) maps every GS question to the syllabus, so you know what UPSC asks and how often.
View the BookDownload Free Sample« Previous: Theory of Machines | Next: Thermodynamics, Gas Dynamics and Turbine »
Back to: Mechanical Engineering Optional PYQs – Topic-wise
Last updated: 30 October 2026