
Here are all 122 Signals and Systems questions asked in UPSC Electrical Engineering Optional Paper I from 1995 to 2026, arranged under the 6 topics of the official syllabus. Within each topic the latest questions come first.
Each question ends with a code such as [2024/15m/3b] – the year, the marks, the word limit (where UPSC set one) and the question number in the paper.
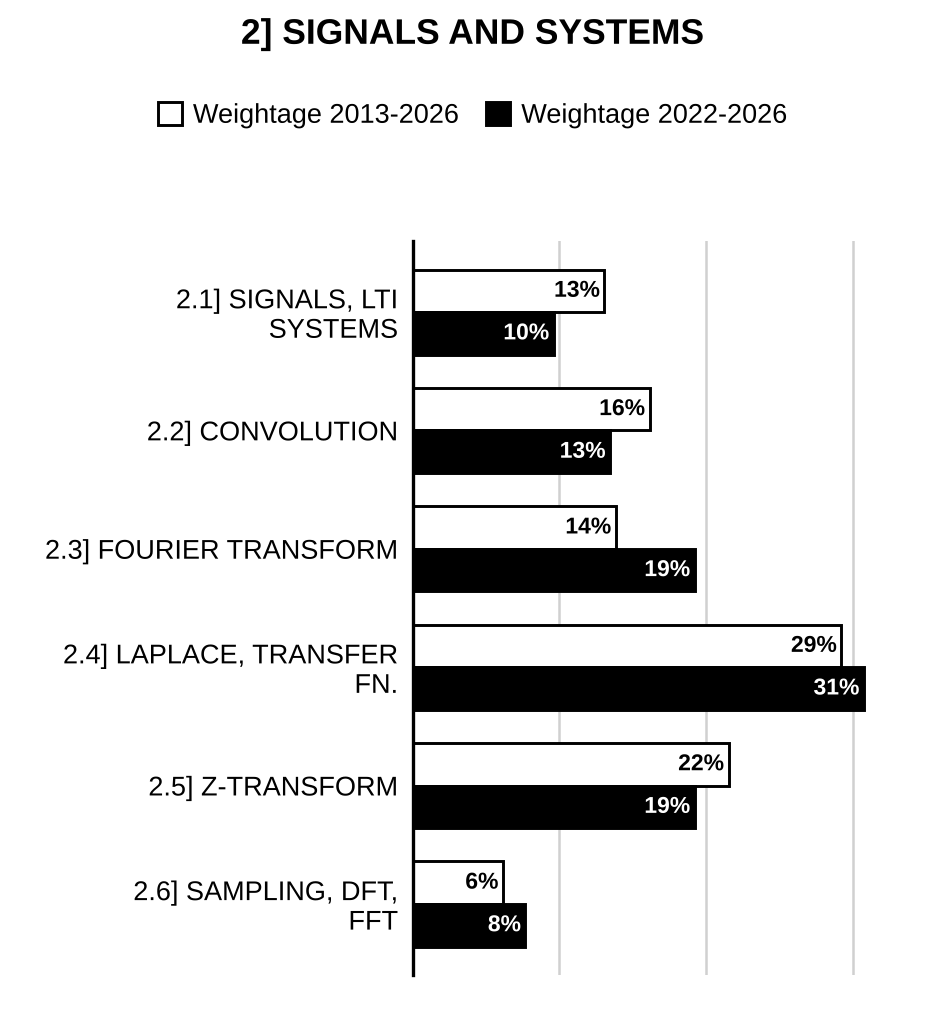
2.1] Signals and LTI systems
17 questions
Consider the continuous-time system shown in the figure above, which is characterized by the following input-output relationships: System 1: System 2: (i) Determine whether the overall system is linear and time-invariant. (ii) Determine and plot impulse response of the overall system.
[Figure: Block diagram (printed above the text): input → block “System 1” → → block “System 2” → output ; the two blocks are enclosed in a dashed box labelled “Overall system”] [2026/10m/1b]
For the signals and shown in the figures below, find and sketch :
[Figure: versus : a rectangular pulse of positive amplitude from to , then a negative level from to (amplitudes not numbered; positive and negative levels drawn of about equal size, i.e. +1 and −1), zero elsewhere; an impulse of strength (+1) at . Axis marks 1, 2, 3.]
[Figure: versus : a constant level 1 drawn from to just beyond ; downward impulses each of strength (−1) at , and .] [2024/20m/2b]
For the signal shown in Figure 1(b), calculate the total energy of the signal . Also sketch .
[Figure: Figure 1(b): versus t: zero for ; rises linearly from 0 at to 1 at ; constant 1 for ; jumps to 2 at and stays at 2 until ; drops to 1 at and stays at 1 until ; falls linearly from 1 at to 0 at ; zero for .] [2021/10m/1b]
(i) Compute the convolution , where (ii) Consider the signal shown in Figure 2(b)(ii) below. Represent the signal in terms of rectangular pulse signal shown in the same figure.
[Figure: Figure 2(b)(ii): versus t (staircase): 1 for , 2 for , 3 for , 2 for , zero elsewhere. : rectangular pulse of height 1 from to .] [2021/20m/2b]
Sketch the continuous-time signal over a suitable range of t, where u(t) is a unit step function. [2020/10m/1b]
A continuous time signal is shown in Fig. 1(b). Sketch and label each of the following signals: (i) (ii)
[Figure: Fig. 1(b): versus (t-axis marked −2, 0, 2, 4; x(t)-axis marked 1, 2). for ; rises linearly from 0 at to 1 at ; constant at 1 for ; steps up to 2 at and stays at 2 for (level 2 shown by a dashed line from the axis); drops to 0 at and is zero thereafter] [2017/10m/1b]
Determine whether the following system is linear, time invariant, stable or dynamic: [2014/10m/2c]
Determine whether the following signal is periodic or aperiodic. Find the fundamental period, if it is periodic: [2014/10m/4c]
The discrete time system is described by . Check whether this system is causal/time variant. [2010/5m/1a(iii)]
Sketch the following function and determine the energy or power contained in a signal: [2010/5m/5a(ii)]
Sketch the function and express it as a sum of shifted unit impulses. is a unit step sequence. [2009/5m/5a(i)]
Impulse response of two systems are given as Determine which of the above systems are (1) causal, (2) memory less. [2006/5m/5b(i)]
A continuous time LTI system is described by Find the impulse response of the system. Is the system casual? [2005/5m/1a(i)]
Develop the relation between unit step sequence and unit sample sequence. [2004/4m/1a(iv)]
How can you express a discrete signal as a sequence of a sum of scaled delayed unit sample sequence? [2004/4m/1a(v)]
What are energy and power signals? Compute the energy and power contents of the following signals and indicate whether they are energy or power signals ; . [2003/6m/2a(iv)]
Use the properties of the unit impulse function δ(t) to evaluate the following integrals.
(i) [2002/10m/5b(i)]
(ii) [2002/10m/5b(ii)]
2.2] Convolution and time-domain analysis
20 questions
Consider the continuous-time system shown in the figure above, which is characterized by the following input-output relationships: System 1: System 2: (i) Determine whether the overall system is linear and time-invariant. (ii) Determine and plot impulse response of the overall system.
[Figure: Block diagram (printed above the text): input → block “System 1” → → block “System 2” → output ; the two blocks are enclosed in a dashed box labelled “Overall system”] [2026/10m/1b]
Impulse response of an LTI system, is defined in the interval . If the input to the LTI system is zero except in the interval , find the interval for which the output exists in forms of , , and . [2025/10m/3c]
For the network shown in Figure 4(a)(i) and its excitation function shown in Figure 4(a)(ii), find the response using convolution by: (i) ‘s’ domain approach. (ii) time domain analytical approach. (iii) graphical convolution approach.
[Figure: Figure 4(a)(i): Source (+ terminal on top) on the left; its top connects through a 1 Ω resistor to the output node; a 1 F capacitor from the output node to the bottom wire; output terminals on the right labelled , + at top and − at bottom (across the capacitor). Figure 4(a)(ii): excitation versus t: a rectangular pulse of height V from to , zero elsewhere.] [2022/20m/4a]
(i) Compute the convolution , where (ii) Consider the signal shown in Figure 2(b)(ii) below. Represent the signal in terms of rectangular pulse signal shown in the same figure.
[Figure: Figure 2(b)(ii): versus t (staircase): 1 for , 2 for , 3 for , 2 for , zero elsewhere. : rectangular pulse of height 1 from to .] [2021/20m/2b]
The unit-impulse response of a linear time-invariant continuous-time system is given by . Determine the system response y(t) for an input , where u(t) is a step function. [2020/20m/2b]
Determine and sketch the convolution of the two signals given below: and [2019/10m/3b]
An LTI system is characterised by the following difference equation: (i) Find the impulse response of the system, if the input to the system is . (ii) Find the frequency response of the output y(jω), and y(n). [2019/20m/7a]
Determine the overall impulse response, , of the system shown in Fig. 1(b) below. Given that where and denote, respectively, the unit impulse and unit step signals:
[Figure: Fig. 1(b): Block diagram: input → → → in cascade; the output of branches into two parallel blocks, (upper) and (lower); both outputs go to a summing junction, the output entering with a “−” sign and the output with a “+” sign; the summer output is the overall output] [2016/10m/1b]
A system consists of two blocks connected in cascade. The first block has impulse response . The second block is shown below: Find the impulse response of the overall system using the relation .
[Figure: Second block (two-port): series inductor L in the upper line from the input terminal to the output terminal; a shunt element across the output, drawn with a capacitor symbol but labelled R; lower line common between input and output. Input terminals on the left, Output terminals on the right] [2012/20m/2b]
Obtain the convolution sum for , using the property . Assume , [2010/10m/2a(ii)]
The input ()-output () relationship for the system is given by Determine for unit step sequence input. [2010/10m/4a(iii)]
A series RC circuit with , is excited by input . Obtain the expression for voltage across the capacitance in time domain, using the impulse response of the system. [2009/5m/5a(ii)]
A system has impulse response . What would be the response of the system, if it is excited by a delayed unit step function (delay = T)? [2007/10m/5a(ii)]
Determine impulse response of the system described by difference equation . [2006/5m/3a(ii)]
Impulse response and input to a discrete time system are given as , . Determine response of the system. [2006/5m/4a(ii)]
The voltage across an impedance in a network is where V(s), Z(s) and I(s) are the Laplace transforms of the corresponding time functions v(t), z(t) and i(t). What will be the relation among them in the time domain of v(t), z(t) and i(t)? [2004/4m/1a(iii)]
Draw the block diagram of the system represented by the following constant coefficient difference equation where x(n) = input sequence and y(n) = output sequence. [2004/10m/1b(ii)]
Find the output response to an input for the system whose unit sample response is as follows: for [?]; for . [2004/10m/4a(ii)]
Solve the difference function given by If the initial conditions are and and the input function is . [2003/10m/1b(i)]
A rectangular pulse g(t) exists between T = – (T/2) and t = + (T/2). Sketch the pulse obtained by convoluting g(t) with itself. The Fourier transform of g(t) is a sine function Write down the Fourier transform of the pulse obtained by the above convolution. [2003/10m/3a(i)]
2.3] Fourier transform
22 questions
A continuous-time signal , shown in the figure below, has a Fourier transform . Without explicitly determining , compute the following quantities: 1. The value of 2. The value of the integral 3. The value of the integral 4. The phase angle of
[Figure: Triangular pulse versus (axis ticks −2, −1, 0, 1, 2, 3, 4): for ; rises linearly from 0 at through 1 at to the peak 2 at (dashed lines mark the peak value 2 and ); falls linearly to 0 at ; zero for ] [2026/10m/2b(i)]
Determine the time domain signal corresponding to the DTFT given below:
[Figure: Two plots versus (ticks at , , , , , , 0, , , , , , ), periodic with period (dashed lines at both ends indicate continuation). Upper plot, magnitude : equal to for (curve labelled “sin (Ω)”, zero at , rising to 1 at , with vertical drops to zero at ) and zero for ; the same shape is repeated about (between and , and between and ). Lower plot, phase : straight line through the origin rising from at to at (end points marked by dots), repeated in each period (through on the axis), i.e. sawtooth between and ] [2025/10m/1b]
Find the Fourier transform of the following signals: (i) (ii) Specify the properties used. [2025/20m/4b]
The figure shows a triangular pulse which is zero for all time except . For this pulse (I) determine the Fourier transform. (II) sketch the continuous amplitude spectrum.
[Figure: Triangular pulse : zero at , rising linearly to peak at , falling linearly to zero at ; zero elsewhere.] [2023/10m/3b(i)]
A mixer (analog multiplier) is used as a process in some analog communication systems. Two signals and are mixed to produce the output . If and , then calculate and plot the magnitude of the Fourier transform of output signal. Further, specify and prove the property of Fourier transform used in calculations. [2021/10m/3c]
Find in the circuit shown in Figure 6(b) using Fourier transform method when Amp.
[Figure: Figure 6(b): Current source (arrow pointing upwards) in the left branch; in parallel with it a 2 Ω resistor in the middle branch; the right branch is a 4 Ω resistor in series with a 0.5 F capacitor, carrying current downwards (arrow at the top of the right branch); all three branches connected between a common top rail and a common bottom rail] [2018/20m/6b]
Figure 2 shows a square wave that is described through the range from 0 to by , and through the range from to by . Find its Fourier components in the exponential series.
[Figure: Fig. 2 – Periodic square wave plotted against : value +2 from 0 to and from to (and up to on the left), zero from to 0 and from to ; axis marks , 0, , ; amplitude marked +2.] [2013/10m/1b]
Using duality property show that the Fourier transform of is equal to where is the unit step. [2012/12m/1b]
Find the Fourier transform of the signum function. [2011/15m/1b]
A power signal has a power . Find the power density spectrum of the signal . [2011/20m/3a]
Using Fourier transform method, obtain expression for in the following network (Fig. 10):
[Figure: Fig. 10 – Current source (arrow upwards) in parallel with a 0.5 Ω resistor and a 1 F capacitor; is the voltage across the parallel combination (top terminal positive)] [2010/6m/6a(i)]
State the differentiation property of Fourier transforms. Hence, obtain the Fourier transform of a Signum function. Sketch its magnitude spectrum. [2010/4m/6a(iii)]
Using Fourier transforms, find the impulse response of the system described by the equation where is an input and is an output. [2009/10m/2a(i)]
Determine Fourier transform of the function . Sketch its magnitude spectrum. Assume . [2009/7m/8a(iii)]
Determine the time signal represented by the DTFS coefficients given in the figure below:
[Figure: Stem plot of X[k] against k (periodic, “…” at both ends): unit-height lines at k = −1 and k = 1 (height marked 1) and a negative line of value −1/2 at k = 0, repeated with period 7 (positive lines at k = −8, −6, 6, 8, ±13 …; negative lines at k = ±7); axis labels printed −6, −4, 4, 8 [?]] [2006/5m/7a(ii)]
Find the Fourier transform of the signal [2005/5m/5a(ii)]
What are the conditions for distortion less transmission in continuous time LTI systems and discrete time LTI systems? [2005/5m/5b(iii)]
Find the CTFS harmonic function for the signal by sampling above the Nyquist rate over exactly one fundamental period and finding the DTFS harmonic function of the samples. [2005/10m/8a(i)]
Obtain the frequency response of the first-order recursive system represented by constant coefficient difference equation . Consider the system is initially relaxed. [2004/10m/2a(iii)]
A rectangular pulse g(t) exists between T = – (T/2) and t = + (T/2). Sketch the pulse obtained by convoluting g(t) with itself. The Fourier transform of g(t) is a sine function Write down the Fourier transform of the pulse obtained by the above convolution. [2003/10m/3a(i)]
A filter has transfer function . Where An input x(t) 2 W sinc (2Wt) is applied to this filter, where
(i) Find the output y(t) for W < B. [2002/7m/2a(i)]
(ii) Find the output y(t) for W > B. [2002/7m/2a(ii)]
(iii) In which case does the output suffer distortion? Justify your answer [2002/6m/2a(iii)]
Show that the multiplication of a sinusoidal signal by a signal f(t) translates the whole frequency spectrum. Can we retranslate the spectrum to its original position? If yes how? [2001/20m/2a]

Preparing for Prelims too?
Our UPSC Prelims Topic-wise PYQ eBook covers every Prelims question with detailed explanations, so you can see exactly where UPSC asks from.
View the BookDownload Free Sample2.4] Laplace transform and transfer function
32 questions
Determine the time signal that corresponds to the following bilateral Laplace transform and the ROCs given below by using the method of partial fractions: (i) With ROC (ii) With ROC (iii) With ROC [2024/20m/3a]
Obtain the Laplace transform of the following periodic waveforms:
[Figure (i): Sawtooth : rises linearly from 0 at to 1 at , drops to 0, and repeats with period (ramps over 0–a, a–2a, 2a–3a, …).]
[Figure (ii): Periodic waveform: rises linearly from 0 at to 1 at , stays at 1 up to , falls linearly to 0 at , rises linearly to 1 at and continues at 1 (pattern repeating).] [2023/10m/1b]
Find by using convolution for the following and . [2023/10m/3b(ii)]
Determine the Inverse Laplace Transform of the following function: [2022/6m/2b(i)]
Find the initial and final value of the current whose Laplace Transform is given below: [2022/4m/2b(ii)]
Solve the following differential equation: Given that and . [2022/10m/2b(iii)]
Apply the Routh-Hurwitz (R-H) criterion to the polynomial in order to determine the number of roots, with positive real parts, with zero real parts and with negative real parts. Also, state about the stability of the system represented by . [2022/10m/3b(i)]
For the network shown in the Figure 3(b)(ii), find the impulse response.
[Figure: Figure 3(b)(ii): Source (+ terminal on top) on the left; its top connects through a 1 Ω resistor to a middle node. A 1 F capacitor from the middle node to the bottom wire, with voltage across it (+ at the top). From the middle node a 1 H inductor goes right, then a 3 Ω resistor down to the bottom wire. The bottom wire returns to the − terminal of the source.] [2022/10m/3b(ii)]
Find the Laplace transform of the following signals: (i) (ii) [2019/10m/5a]
Find the Laplace transform of the periodic function f(t) shown in Figure 1(b).
[Figure: Figure 1(b): Periodic waveform f(t) against t (t-axis marked 0, 1, 2, 3, 4, 5; f(t) axis marked 2). f(t) rises linearly from 0 at t = 0 to 2 at t = 1, drops vertically to 0 at t = 1 and stays 0 from t = 1 to t = 2; the same ramp repeats from t = 2 to t = 3 (rising to 2) and from t = 4 to t = 5, with f(t) = 0 from 3 to 4; period 2] [2018/10m/1b]
Find the Laplace transform of the function . [2017/20m/4b]
Consider a continuous-time LTI system for which the input and output are related by the following differential equation: Determine the impulse response, , of the system for the following cases by plotting pole-zero pattern: (i) The system is causal. (ii) The system is stable. (iii) The system is neither stable nor causal. [2016/20m/2b]
Find the Laplace transform of the function: for . [2015/20m/3a]
The transfer function of a system is given as: Find out the impulse response of the system. [2015/10m/4c]
Find the Laplace transform of the signal and find ROC. [2014/20m/3a]
Sketch the following function and find its Laplace transforms: is unit ramp function. [2010/5m/5a(i)]
A linear network has a driving-point admittance given by Determine current in the network supplied by unit impulse voltage. What would be the current in the circuit when a unit step voltage is applied? [2010/10m/8a(i)]
Determine Laplace transform of the function shown below.
[Figure: Triangular pulse : rises linearly from 0 at to 2 at , falls linearly to 0 at , zero elsewhere] [2009/5m/5a(iii)]
State and prove the frequency-shift theorem. Determine the Laplace transform of f(t) shown in the figure, using the frequency-shift theorem.
[Figure: Graph of f(t) against t: f(t) follows the decaying exponential envelope (arrow label) during the intervals 0 to 1, 2 to 3, 4 to 5, 6 to 7 and 8 to 9, and is zero in between (rectangular-topped pulses of unit width with exponentially decaying tops, starting from a peak at t = 0); t-axis marked 0, 1, 2, 3, 4, 5, 6, 7, 8] [2007/10m/5a(i)]
Determine inverse Laplace transform of [2006/5m/1b(i)]
define a network function and explain how the poles & zeros are related to a network function. [2006/5m/2a(i)]
Find the poles and zeros of the networks shown below.
[Figure: One-port between two input terminals (top and bottom wires) with three parallel branches across it: (1) 1 H inductor in series with 1 Ω resistor; (2) 1 F capacitor; (3) 1 Ω resistor.] [2005/5m/3a(ii)]
Find the Laplace transform of the stepped waveform shown below.
[Figure: Staircase waveform f(t) versus t: f(t) = 1 for 0 < t < T, 2 for T < t < 2T, 3 for 2T < t < 3T, 4 for 3T < t < 4T, and zero after 4T (the step heights 2, 3, 4 are marked by double-headed arrows at T, 2T and 3T; vertical axis marked 1, 2, 3, 4; horizontal axis marked T, 2T, 3T, 4T).] [2005/5m/5a(iii)]
Determine Laplace transform of the waveform f(t) as shown in the figure below:
[Figure: Rectangular waveform f(t) versus t: f(t) = 1 for 0 < t < 2; −2 for 2 < t < 4; +2 for 4 < t < 6; −2 for 6 < t < 8; zero for t > 8 (vertical axis marked −2, −1, 0, 1, 2; horizontal axis marked 2, 4, 6, 8, 10).] [2004/4m/1b(i)]
Use final value theorem to find for the function , where . [2004/4m/2a(i)]
Consider the function of complex frequency s of the following expression: Find the Laplace inverse function of the above expression. [2004/8m/3a(i)]
Enumerate different properties of the ROC for Laplace transform and find out the I.L.T of for the different ROC’s , , [2003/10m/1b(ii)]
Find the Laplace transform L(t) of the following function . Given Using the result of , find [2003/10m/3a(ii)]
How do you determine the Laplace transform of a function f(t)? Are there any restrictions on f(t) for this? State them. Determine the Laplace transforms of (i) signal in the form of a triangular pulse and (ii) impulse train as shown below. The strength of each impulse is unity.
[Figure: Left, “Triangle pulse”: x(t) rises linearly from 0 at t = 0 to a peak value 1 at t = T/2 and falls linearly to 0 at t = T. Right: impulse train x(t) of unit impulses (height 1) at t = 0, T, 2T, 3T, 4T.] [2001/20m/5a]
Determine the relationship between , , L and C of the circuit shown below so that the poles of the function V(s)/I(s) are complex.
[Figure: Current source I(s) (arrow pointing up) in the left vertical branch between the top and bottom wires; shunt branch from the top wire to the bottom wire: in series with L; capacitor C in series along the top wire after this branch; then shunt resistor from the top wire to the bottom wire; output terminals at the right end of the top and bottom wires, V(s) across them (i.e. across ).] [2000/20m/1a]
Explain the concept of complex frequency. Discuss its usefulness in specifying network functions. [1999/20m/1a]
Determine (i) and (ii) for the network shown in the above figure.
[Figure: Source (a.c. symbol) on the left delivering current (arrow along the top wire) to two parallel branches connected between the top wire and the bottom wire: branch 1 – a 1 Ω resistor from the top wire down to node A, then a capacitor of impedance from A to the bottom wire; branch 2 – an inductor of impedance and a 1 Ω resistor in series from the top wire down to node B, then a capacitor of impedance from B to the bottom wire; is the voltage between nodes A and B] [1999/20m/2b]
2.5] Z-transform
22 questions
Determine the -transform and the corresponding region of convergence (ROC) for the discrete-time sequence . [2026/10m/2b(ii)]
Determine the causal signal if its z-transform is specified by a pole-zero pattern shown in the figure below. Take the constant .
[Figure: z-plane (Re, Im axes). Zeros (○) on the real axis at and . Poles (×): one on the real axis at ; a complex-conjugate pair at radius (dashed radial lines from the origin) and angles (angle marked from the positive real axis); in the drawing the upper pole sits above the tick, with a short dashed vertical line below it] [2025/10m/2c]
Determine the -transform of . Specify the properties used. [2024/10m/1b]
A causal discrete-time LTI system is described by: where x[n] and y[n] are the input and output of the system respectively. (i) Determine the system transfer function H(z). (ii) Find the impulse response h[n] of the system. (iii) Find the step response s[n] of the system. [2023/20m/2b]
Consider a discrete time system with transfer function given by Calculate the following: (i) The impulse response of the system (ii) The step response of the system with zero initial conditions (iii) The step response of the system with initial conditions and [2021/20m/4a]
Find the Z transform of a discrete sequence , where u[n] is a unit step sequence. [2020/10m/3c]
Find the Z-transform of the signal . Also find the ROC. [2019/10m/8d]
Determine the transfer function and therefrom the impulse response of the causal linear time invariant system described by the difference equation [2017/20m/6b]
Determine the causal signal, , having its z-transform [2016/10m/4a]
Find the z transform of: for . [2015/10m/2c]
Determine the inverse -transform of for ROC [2014/10m/1c]
The block diagram of a discrete time LTI system is given below: Determine the transfer function .
[Figure: enters adder A1 whose output w(n) passes through a delay to node w(n−1) and a second to node w(n−2); w(n−1) through gain −1/3 and w(n−2) through gain 1/6 enter adder A2, whose output is added back into A1. Node w(n) feeds two parallel branches: upper – gain 2/3 into adder A3; the output of A3 goes through and gain −1/3 back into A3; lower – gain 1/3 into adder A4; the output of A4 goes through and gain 1/6 back into A4. The outputs of A3 and A4 are added in adder A5 to give ] [2012/20m/4a]
Using transforms, obtain the convolution sum of two sequences, , where is a unit step sequence. [2009/10m/2a(ii)]
Find transform of the function Sketch its RoC. [2009/8m/8a(ii)]
Solve the following difference equation by use of the z transform method: [2007/10m/2a(i)]
Obtain the inverse z transform of: [2007/10m/2a(ii)]
Prove that where without any change in ROC. [2006/5m/8a(ii)]
Find the inverse z-transform of Where and . [2005/7m/6a(i)]
Find the z-transform of . [2004/12m/5a(ii)]
Find the impulse response of the system whose transfer function is given as follows: which converges , it has a pair of poles at and a double zero at z = 0. [2004/12m/6a(ii)]
The discrete time system is described by the constant coefficient difference equation with initial condition . If the input is applied to the system, what will be the output response? [Solve the problem using z-transform and its inverse transform operation only]. [2004/20m/8a]
A digital filter is characterised by the following recursive relation, where x(n) and y(n) are the input and output samples at the sampling instant. The sampling frequency is 100 Hz. Find the poles and zeros of the discrete-time transfer function of the filter. Hence deduce and sketch the magnitude response characteristic of the filter from to . Mark the values at , 50 and 100 Hz. [1995/20m/2c]
2.6] Sampling, DFT and FFT
9 questions
The continuous-time signal is ideally sampled at a rate of 30 samples per second. The resulting sampled signal is then passed through a filter whose impulse response is . Find the expression for the output signal of the filter. [2026/15m/4a(i)]
A discrete-time sequence of length 9 has a 9-point DFT denoted by , where . Another discrete-time sequence has a 9-point DFT given by Without explicitly computing DFT or inverse DFT, determine the sequence . [2026/5m/4a(ii)]
A continuous-time signal is sampled with a sampling frequency . Obtain the 4-point DFT of the sampled sequence and plot the magnitude and phase spectrum. [2020/20m/4a]
A continuous time signal is given by The signal is sampled with a sample period of seconds. Can we recover the signal from the sampled version using an appropriate low pass filter? [2012/12m/1c]
A signal is sampled with sampling interval of 0.02 second. Can the original signal be recovered from these samples? [2009/5m/8a(i)]
Explain how an analog signal can be constructed from its samples. What are the conditions for faithful reconstruction? Give any one reconstruction circuit. [2006/5m/2a(ii)]
Using the difference equation design method with a backward difference, design a digital filter to simulate the analog filter whose transfer function is using the sampling rate kHz. [2005/10m/3a(i)]
What do you understand by the mathematical relation between continuous and discrete system as given below? where is the frequency response of the sequence x(nT), T is the sampling period and is the Fourier transform of the continuous-time waveform. If the analog frequency response is band limited to the range what will the new relation be? [2004/12m/3a(ii)]
Select any three of the following statement and indicate with justification whether they are correct or incorrect. Your answer must not exceed 200 words for each statement. Digital processing is used widely because it provides economic and rapid manipulation of data. [1995/20m/200w/9d]

Strengthen your GS papers
Our UPSC Mains Topic-wise & Year-wise PYQ eBook (2013–2026) maps every GS question to the syllabus, so you know what UPSC asks and how often.
View the BookDownload Free Sample« Previous: Circuits—Theory | Next: E.M. Theory »
Back to: Electrical Engineering Optional PYQs – Topic-wise
Last updated: 30 October 2026